. 2012 Mar;23(5):918-29.
doi: 10.1091/mbc.E11-07-0622. Epub 2012 Jan 4.

Single-molecule imaging of translational output from individual RNA granules in neurons

Affiliations

Single-molecule imaging of translational output from individual RNA granules in neurons

Vedakumar Tatavarty et al. Mol Biol Cell. 2012 Mar.

Abstract

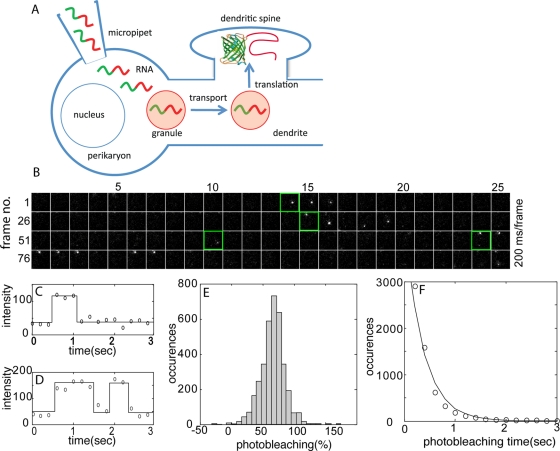
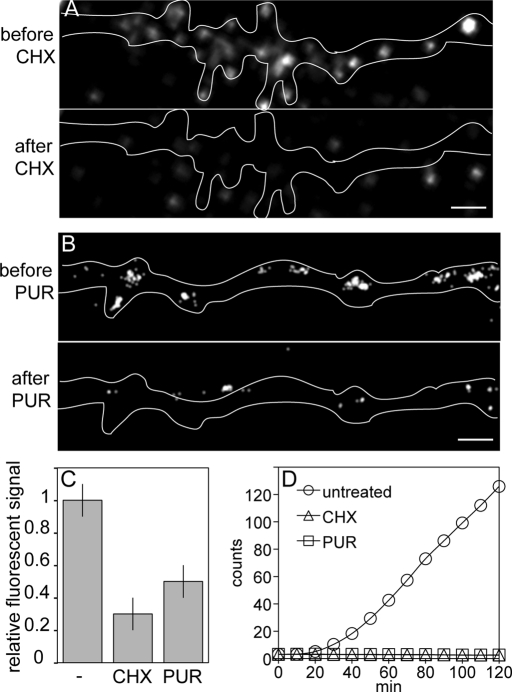
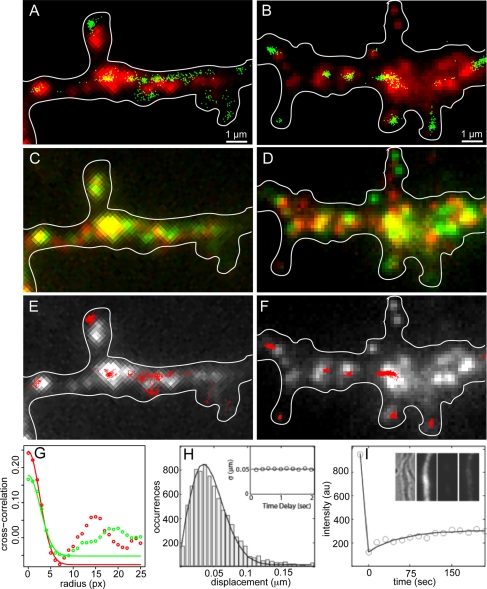
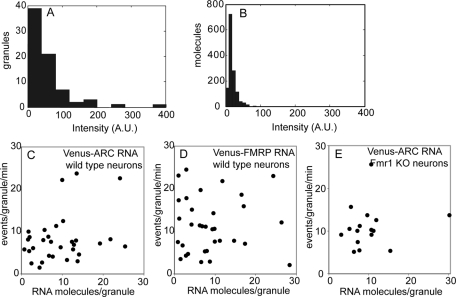
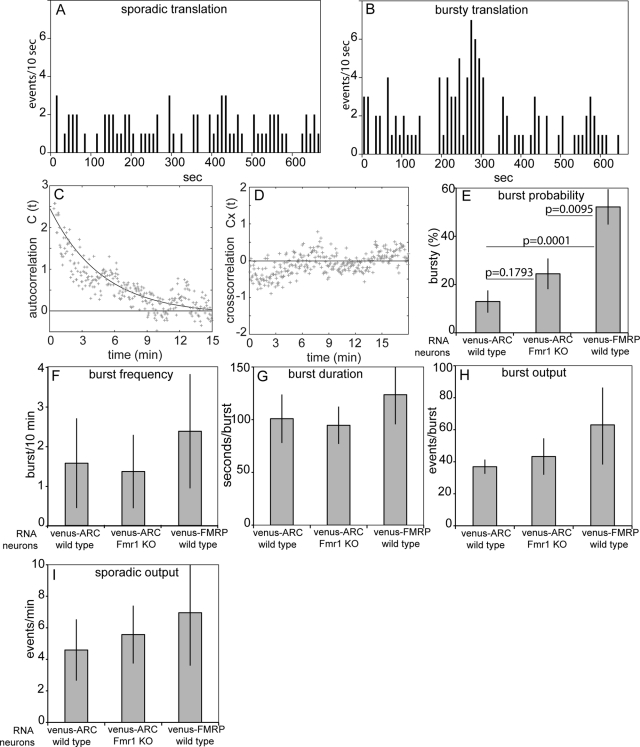
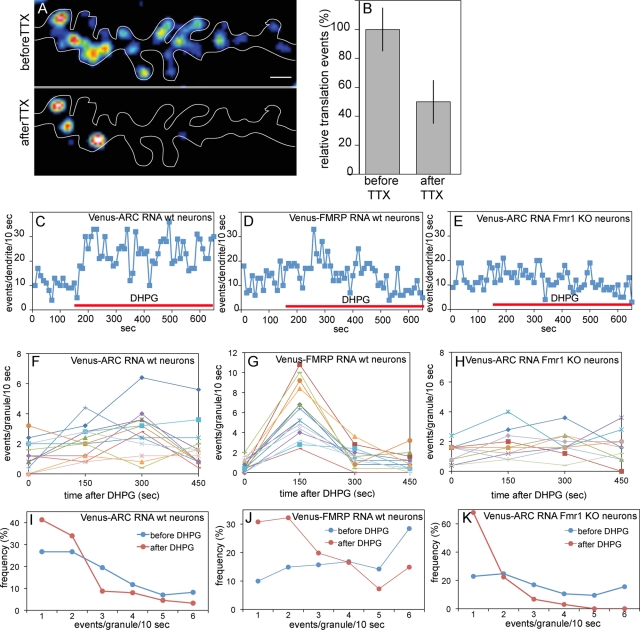
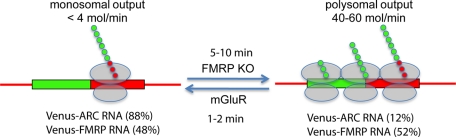
Dendritic RNAs are localized and translated in RNA granules. Here we use single-molecule imaging to count the number of RNA molecules in each granule and to record translation output from each granule using Venus fluorescent protein as a reporter. For RNAs encoding activity-regulated cytoskeletal-associated protein (ARC) or fragile X mental retardation protein (FMRP), translation events are spatially clustered near individual granules, and translational output from individual granules is either sporadic or bursty. The probability of bursty translation is greater for Venus-FMRP RNA than for Venus-ARC RNA and is increased in Fmr1-knockout neurons compared to wild-type neurons. Dihydroxyphenylglycine (DHPG) increases the rate of sporadic translation and decreases bursty translation for Venus-FMRP and Venus-ARC RNAs. Single-molecule imaging of translation in individual granules provides new insight into molecular, spatial, and temporal regulation of translation in granules.


Figures

FIGURE 1:
FIGURE 1:
Single-molecule detection of newly synthesized Venus-ARC protein molecules in injected cells. (A) Experimental procedure. Fluorescently labeled RNA molecules (green/red squiggles) encoding Venus-ARC or Venus-FMRP were microinjected into the perikaryon of cultured hippocampal neurons. Microinjected RNA molecules assemble into RNA granules (light red circles) that are transported along dendrites to dendritic spines, where translation occurs. Newly synthesized Venus fusion protein molecules undergo fluorophore maturation and are detected by single-molecule imaging. (B) Time-lapse images (100 frames, 200 ms/frame, total time 20 s) of a single region of interest (ROI; 2.5 × 2.5 μm) within a dendrite. Four temporal trajectories corresponding to four separate translational events within the ROI are detected in the sequence shown. The initial frame of each trajectory is outlined in green. (C) Normalized fluorescence intensity trajectories for molecules corresponding to trajectories 1 and 4 in A illustrating single-step appearance, photobleaching, and blinking, consistent with single-molecule behavior. (D) Histogram of photobleaching coefficients (PBs) for single-molecule trajectories. (E) Distribution of photobleaching times for fluorescent molecules. The solid curve represents the fit to a single-exponential decay.
FIGURE 2:
FIGURE 2:
Inhibition of protein synthesis with cycloheximide and puromycin. (A) Single-molecule imaging of Venus-ARC protein in a dendritic segment before and after treatment with CHX. Scale bar, 1 μm. (B) Single-molecule imaging of Venus-ARC protein in a dendritic segment before and after treatment with PUR. Scale bar, 1 μm. (C) Relative fluorescence signal in untreated and CHX- and PUR-treated dendritic segments shown in A and B. (D) FCS-IVT of Venus-ARC RNA in the presence and absence of CHX and PUR.
FIGURE 3:
FIGURE 3:
Translation event maps for Venus-ARC and Venus-FMRP RNAs in wild-type hippocampal neurons. (A, B) Locations of individual Venus-ARC or Venus-FMRP granules (red) were determined by imaging microinjected fluorescent RNA in a dendritic segment. Centroid coordinates for newly synthesized Venus-ARC or Venus-FMRP protein molecules (green) determined by single-molecule imaging in the same dendritic segment are superimposed on the granule image. (C, D) Translocation of Venus-ARC and Venus-FMRP RNA granules over time. The first frame (t = 0 min; shown in red) was superimposed on the last frame (t = 5; min, shown in green) to evaluate how far each granule moved during the period immediately prior to imaging of translation events. (E, F) Spatial trajectories for individual newly synthesized Venus-ARC and Venus-FMRP protein molecules were calculated by plotting centroid coordinates for individual molecules in sequential frames. Single-molecule spatial trajectories for several individual protein molecules (red) are overlaid on granule images (white). (G) Image cross-correlation analysis of translation events and RNA granules for Venus-ARC and Venus-FMRP. Centroid coordinates for newly synthesized Venus-ARC and Venus-FMRP molecules, as shown in Figure 2, A and B, respectively, were mapped onto individual pixels to create translation intensity images that were cross-correlated with the corresponding RNA granule images, as shown in Figure 2, A and B, to generate the cross-correlation functions. In each case the initial amplitude of the cross-correlation function provides a measure of Pearson's coefficient of correlation between translation events and RNA granules. The decay of cross-correlation as a function of distance provides a measure of the spatial distributions of translation events in relation to RNA granules. The secondary peak in the cross-correlation function may indicate either correlation with secondary granules in the vicinity of the primary granule or granule translocation between the time granules were imaged and the time translation events were recorded. (H) Histogram of apparent single-molecule displacements between adjacent imaging frames. The displacement is defined as the distance between the centroid positions of the same fluorescence spot in two successive frames. The solid curve is fitted to the Gaussian random walk model: P(r) = r exp(-r2/2σ2). The inset shows the σ value vs. different time delays for calculating displacements. (I) FRAP results for Venus-ARC protein. Intensity data are plotted in open circles. Solid line is the exponential recovery fit. Dendrite ROI images in the inset are, from left to right, bright-field image, fluorescence image before photobleaching, fluorescence image after photobleaching, and fluorescence image after recovery for 3 min.
FIGURE 4:
FIGURE 4:
Specific translation activities for Venus-ARC and Venus-FMRP RNA granules in wild-type and Fmr1 KO neurons. (A) Fluorescence intensities for individual well-resolved granules containing Venus-ARC RNA. (B) Fluorescence intensities for individual RNA molecules immobilized on glass coverslips, imaged under the same conditions as in A. (C–E) Specific translation activities for granules containing Venus-ARC RNA in wild-type neurons, Venus-FMRP RNA in wild-type neurons, and Venus-ARC in Fmr1 KO neurons are plotted with number of RNA molecules per granule (determined by comparing the total fluorescence intensity of the granule with the average intensity of individual RNA molecules) on the x-axis and number of events per granule per minute on the y-axis. The number of events per granule was determined by counting the number of centroids corresponding to newly synthesized Venus fusion proteins that appeared in the vicinity of each well-resolved granule over a period of 10 min.
FIGURE 5:
FIGURE 5:
Translation event schedules and translation output parameters for Venus-ARC and Venus-FMRP RNA granules in wild-type and Fmr1 KO neurons. Translation event schedules for individual granules were generated by recording times of first appearance for each newly synthesized molecule in a cluster of centroids associated with a well-resolved granule. (A, B) representative sporadic and bursty schedules for individual granules. (C) average autocorrelation function for bursty translation event schedules in granules containing Venus-ARC RNA in wild-type neurons. The solid line represents fitting of the autocorrelation data to a single-exponential decay function with a time constant of 4.2 min, corresponding to the average maturation time of Venus. (D) Average cross-correlation function for bursty translation event schedules in different granules. (E–I) Burst probabilities, burst frequencies, burst durations, burst outputs, and sporadic outputs for Venus-ARC and Venus-FMRP granules in wild-type and Fmr1 KO neurons. In each case average values and standard deviations were determined for schedules from > 40 different granules. Fisher's exact test was used to calculate p values for burst probabilities in E.
FIGURE 6:
FIGURE 6:
Synaptic activity affects translation output in granules containing Venus-ARC or Venus-FMRP RNA in wild type and Fmr1 KO neurons. (A, B) Translation activity in a dendritic segment before and after TTX treatment. (C–E) Translation activity in dendritic segments before and after DHPG treatment. (F–H) Translation activity in individual granules before and after DHPG treatment. The value at time 0 represents the average output during the 150 s prior to DHPG addition, the value at time 150 s represents the average output during the first 150 s after DHPG addition, the value at 300 s represents the average output between 150 and 300 s after DHPG addition, and the value at 450 s represents the average output between 300 and 450 s after DHPG addition. (I–K) Frequency distributions for translation events in granules before and after DHPG treatment.
FIGURE 7:
FIGURE 7:
Summary diagram for sporadic and bursty translation output in granules. RNA molecules are shown with Venus ORF as a green rectangle and ARC or FMRP ORF as a red rectangle and 5′ and 3′UTRs as red lines. Ribosomal subunits translating RNA molecules are shown as semitransparent ovals. Nascent polypeptide chains for Venus-ARC or Venus-FMRP fusion proteins are shown as linear arrays of small green and red circles. Left, sporadic output corresponding to monosomal translation. Right, bursty output corresponding to polysomal translation. mGluR increases the rate of monosomal translation. FMRP KO increases the probability of polysomal translation.

Similar articles

Cited by

References

    1. Antar LN, Dictenberg JB, Plociniak M, Afroz R, Bassell GJ. Localization of FMRP-associated mRNA granules and requirement of microtubules for activity-dependent trafficking in hippocampal neurons. Genes Brain Behav. 2005;4:350–359. - PubMed
    1. Bassell GJ, Warren ST. Fragile X syndrome: loss of local mRNA regulation alters synaptic development and function. Neuron. 2008;60:201–214. - PMC - PubMed
    1. Bourne JN, Sorra KE, Hurlburt J, Harris KM. Polyribosomes are increased in spines of CA1 dendrites 2 h after the induction of LTP in mature rat hippocampal slices. Hippocampus. 2007;17:1–4. - PubMed
    1. Bramham CR, Worley PF, Moore MJ, Guzowski JF. The immediate early gene arc/arg3.1: regulation, mechanisms, and function. J Neurosci. 2008;28:11760–11767. - PMC - PubMed
    1. Castillo PE, Francesconi A, Carroll RC. The ups and downs of translation-dependent plasticity. Neuron. 2008;59:1–3. - PubMed

Publication types

MeSH terms

LinkOut - more resources