. 2012 Apr;67(4):395-405.
doi: 10.1093/gerona/glr223. Epub 2012 Jan 4.

Health span approximates life span among many supercentenarians: compression of morbidity at the approximate limit of life span

Affiliations

Health span approximates life span among many supercentenarians: compression of morbidity at the approximate limit of life span

Stacy L Andersen et al. J Gerontol A Biol Sci Med Sci. 2012 Apr.

Abstract

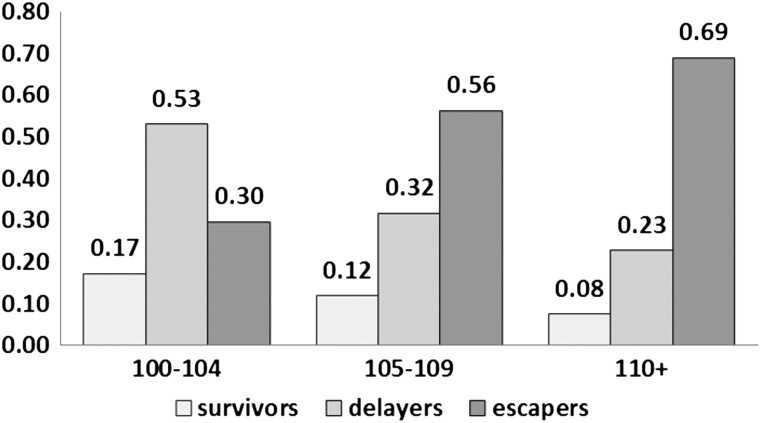
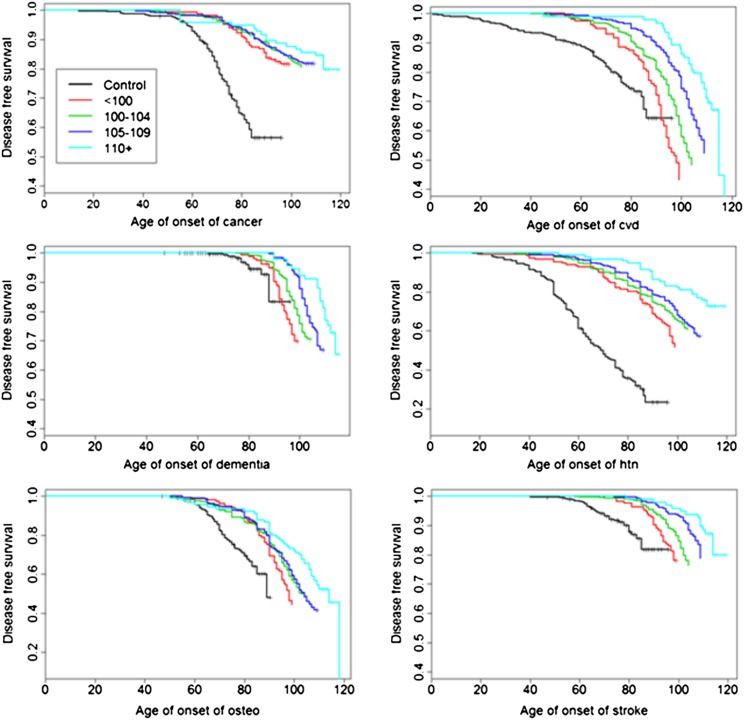
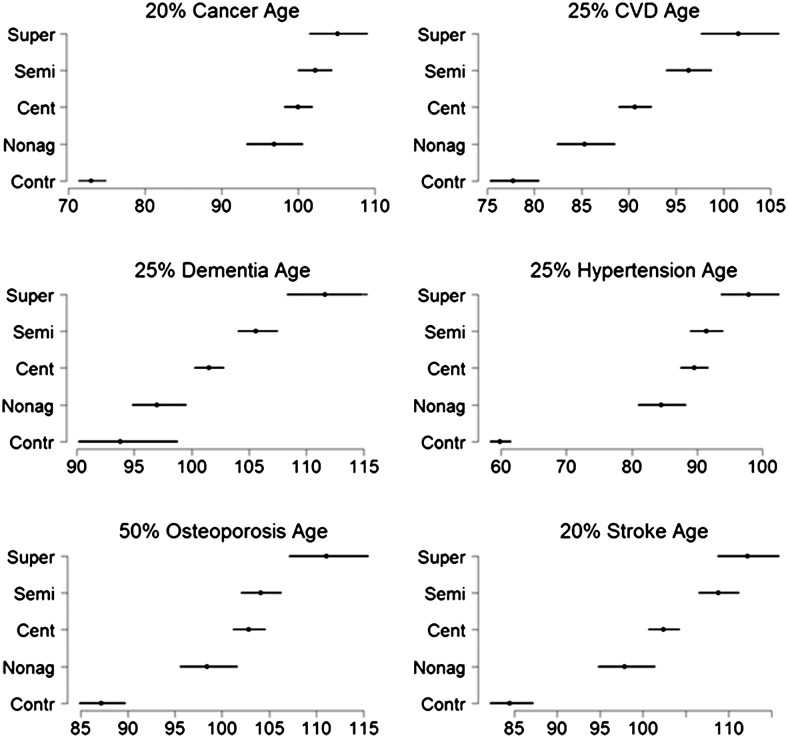
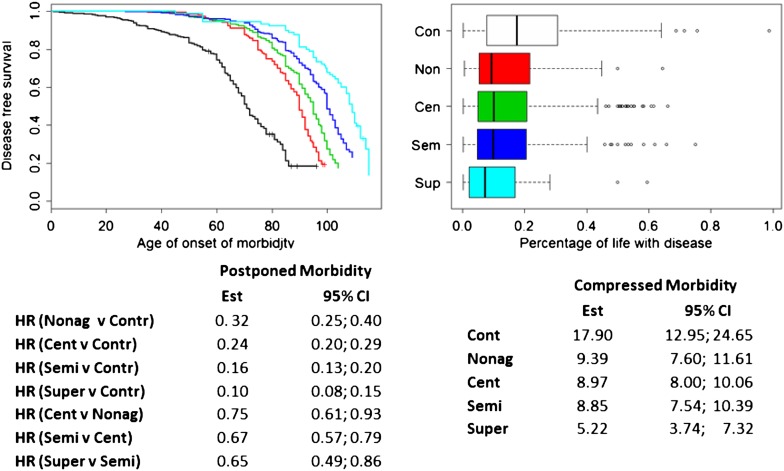
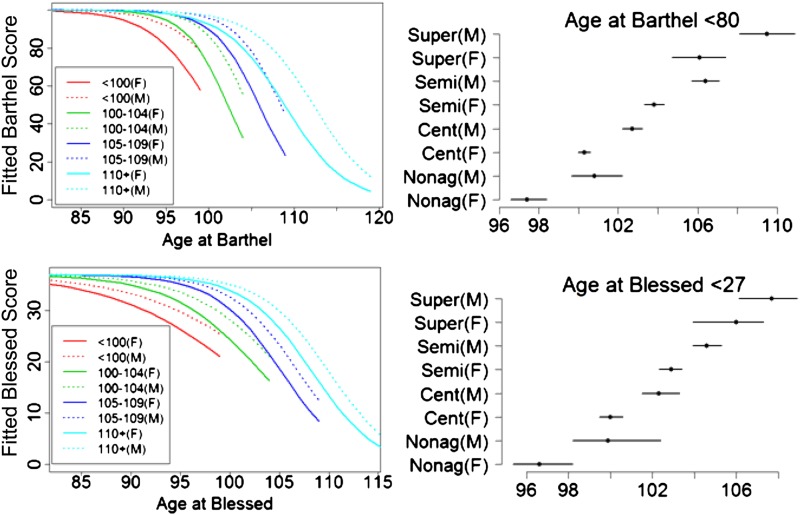
We analyze the relationship between age of survival, morbidity, and disability among centenarians (age 100-104 years), semisupercentenarians (age 105-109 years), and supercentenarians (age 110-119 years). One hundred and four supercentenarians, 430 semisupercentenarians, 884 centenarians, 343 nonagenarians, and 436 controls were prospectively followed for an average of 3 years (range 0-13 years). The older the age group, generally, the later the onset of diseases, such as cancer, cardiovascular disease, dementia, and stroke, as well as of cognitive and functional decline. The hazard ratios for these individual diseases became progressively less with older and older age, and the relative period of time spent with disease was lower with increasing age group. We observed a progressive delay in the age of onset of physical and cognitive function impairment, age-related diseases, and overall morbidity with increasing age. As the limit of human life span was effectively approached with supercentenarians, compression of morbidity was generally observed.


Figures

Figure 1.
Figure 1.
Frequency of survivors (onset of at least one disease prior to age 80 years), delayers (onset of at least one disease between ages of 80 and 99), and escapers (onset of at least one disease after age 100 years) among three age groups: centenarians (100–104 years), semisupercentenarians (105–109 years), and supercentenarians (110+ years). Diseases included in this analysis were cancer, cardiovascular disease, chronic obstructive pulmonary disease, dementia, diabetes, and stroke.
Figure 2.
Figure 2.
Distribution of disease-free survival of common age-related diseases in controls and centenarians stratified by age at death. The survival curves were generated using Kaplan–Meyer estimators. Vertical ticks represent censored events (dead or alive participants without events). “Osteo” is osteoporosis, “htn” is hypertension, and “cvd” is cardiovascular disease.
Figure 3.
Figure 3.
Estimates of ages when specific percentiles of subjects first experienced specific age-related diseases. The percentiles are 20% for stroke and cancer; 25% for cardiovascular disease, dementia, and hypertension; and 50% for osteoporosis and were chosen based on reported prevalences of age-related diseases in (25). The estimates were computed using Weibull regression and the equation age=(ln(1/p)/λ)1/ν, where λ and v are the parameters of the hazard function h(age)=λν(ageν1).
Figure 4.
Figure 4.
Left: delay of morbidity. Morbidity-free survival in controls (black), nonagenarians (red), centenarians (green), semisupercentenarians (blue), and supercentenarians (pale blue). Morbidity was defined by either cancer, cardiovascular disease, dementia, diabetes, or stroke. The table shows the hazard ratios and 95% credible intervals that were estimated using Weilbull regression and Markov Chain Monte Carlo methods. Right: compression of morbidity. The boxplot displays the percentage of years spent with disease (as defined earlier) in controls and the different age groups of centenarians. Only participants with an age at death are included in this analysis. The table provides estimates of the median percentages of life spent with age-related disease and 95% CI that were estimated using a regression model with lognormal distributions.
Figure 5.
Figure 5.
Left panels: trajectories of physical (Barthel) and cognitive (Blessed Information-Memory-Concentration Test) functional declines fitted to the data. The right panels depict the age of onset of functional (Barthel score < 80) and cognitive declines (Blessed score < 27) in the different centenarian age groups by gender. The trajectories were computed using the inverse logistic transformation as explained in methods, and for each age group, they are truncated by the maximum age for their defined age ranges (eg, 99 years for nonagenarians, 104 for centenarians).

References

    1. Young RD, Desjardins B, McLaughlin K, Poulain M, Perls T. Typologies of extreme longevity myths. Curr Gerontol Geriatr Res. 2011:1–12. http://www.hindawi.com/journals/cggr/2010/423087/Accessed December 1, 2011. - PMC - PubMed
    1. Kestenbaum B, Ferguson RB. Number of centenarians in the United States Jan. 1, 1990, 2000 and 2010 based on improved medicare data. N Am Actuar J. 2005;10:1–6. http://ccp.ucr.ac.cr/creles/100m/m-rs05-1_xxvi.pdf. Accessed December 1, 2011.
    1. Bell FC, Miller ML. Life Tables for the United States Social Security Area 1900–2100, Actuarial Study No. 120. 2005. http://www.ssa.gov/oact/NOTES/as120/LifeTables_Tbl_7_1900.html. Accessed September 5, 2011.
    1. Bourbeau R. Demography. Tracking Down Supercentenarians. Universite de Montreal Research Bulletin; 2002. http://www.forum.umontreal.ca/forum_express/pages_a/demo.htmAccessed December 11, 2011.
    1. Robine JM, Allard M. The oldest human. Science. 1998;279:1834–1835. - PubMed

Publication types