

Functional connectivity analyses in imaging genetics: considerations on methods and data interpretation
- PMID: 22220190
- PMCID: PMC3248388
- DOI: 10.1371/journal.pone.0026354
Functional connectivity analyses in imaging genetics: considerations on methods and data interpretation
Abstract
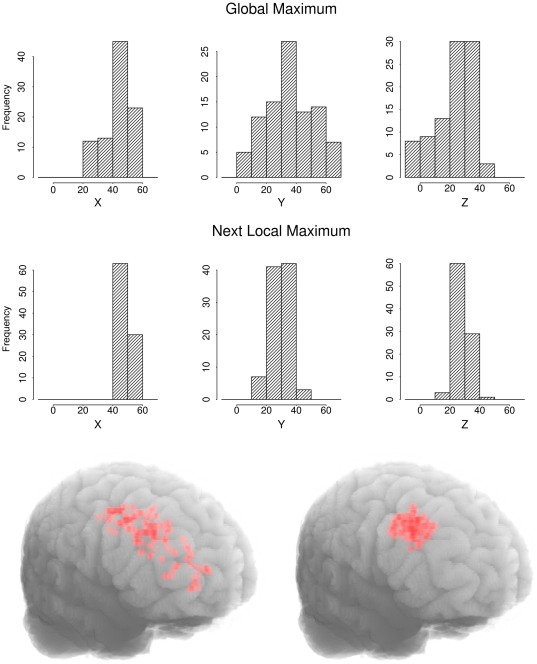
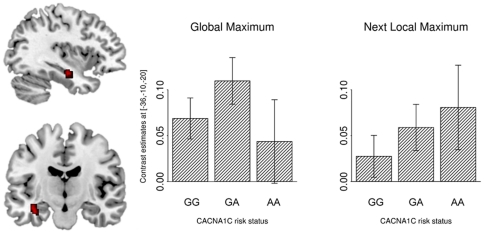
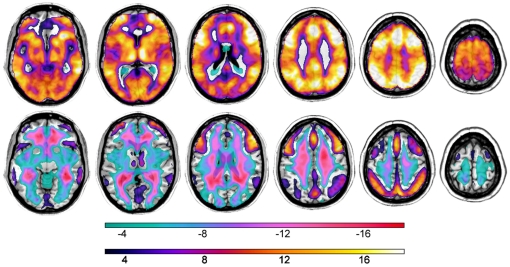
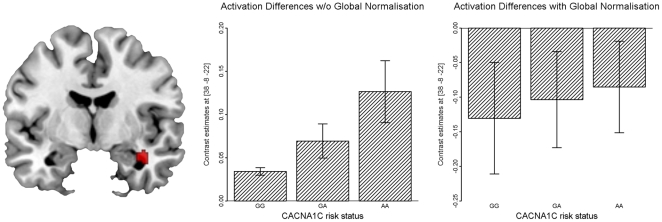
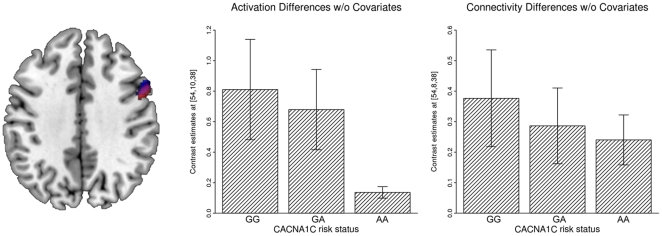
Functional magnetic resonance imaging (fMRI) can be combined with genotype assessment to identify brain systems that mediate genetic vulnerability to mental disorders ("imaging genetics"). A data analysis approach that is widely applied is "functional connectivity". In this approach, the temporal correlation between the fMRI signal from a pre-defined brain region (the so-called "seed point") and other brain voxels is determined. In this technical note, we show how the choice of freely selectable data analysis parameters strongly influences the assessment of the genetic modulation of connectivity features. In our data analysis we exemplarily focus on three methodological parameters: (i) seed voxel selection, (ii) noise reduction algorithms, and (iii) use of additional second level covariates. Our results show that even small variations in the implementation of a functional connectivity analysis can have an impact on the connectivity pattern that is as strong as the potential modulation by genetic allele variants. Some effects of genetic variation can only be found for one specific implementation of the connectivity analysis. A reoccurring difficulty in the field of psychiatric genetics is the non-replication of initially promising findings, partly caused by the small effects of single genes. The replication of imaging genetic results is therefore crucial for the long-term assessment of genetic effects on neural connectivity parameters. For a meaningful comparison of imaging genetics studies however, it is therefore necessary to provide more details on specific methodological parameters (e.g., seed voxel distribution) and to give information how robust effects are across the choice of methodological parameters.
Conflict of interest statement
Figures
Similar articles
-
Fast eigenvector centrality mapping of voxel-wise connectivity in functional magnetic resonance imaging: implementation, validation, and interpretation.Brain Connect. 2012;2(5):265-74. doi: 10.1089/brain.2012.0087. Brain Connect. 2012. PMID: 23016836
-
Quantification of the impact of a confounding variable on functional connectivity confirms anti-correlated networks in the resting-state.Neuroimage. 2014 Feb 1;86:343-53. doi: 10.1016/j.neuroimage.2013.10.013. Epub 2013 Oct 12. Neuroimage. 2014. PMID: 24128734
-
Mapping the after-effects of theta burst stimulation on the human auditory cortex with functional imaging.J Vis Exp. 2012 Sep 12;(67):e3985. doi: 10.3791/3985. J Vis Exp. 2012. PMID: 23007549 Free PMC article.
-
The structural and functional connectivity of the posterior cingulate cortex: comparison between deterministic and probabilistic tractography for the investigation of structure-function relationships.Neuroimage. 2014 Nov 15;102 Pt 1:118-27. doi: 10.1016/j.neuroimage.2013.12.022. Epub 2013 Dec 21. Neuroimage. 2014. PMID: 24365673 Review.
-
A probabilistic approach to discovering dynamic full-brain functional connectivity patterns.Neuroimage. 2018 Oct 15;180(Pt A):243-252. doi: 10.1016/j.neuroimage.2018.01.071. Epub 2018 Feb 12. Neuroimage. 2018. PMID: 29448074 Review.
Cited by
-
A genome-wide supported variant in CACNA1C influences hippocampal activation during episodic memory encoding and retrieval.Eur Arch Psychiatry Clin Neurosci. 2014 Mar;264(2):103-10. doi: 10.1007/s00406-013-0428-x. Epub 2013 Jul 17. Eur Arch Psychiatry Clin Neurosci. 2014. PMID: 23860750
-
Association of rs1006737 in CACNA1C with alterations in prefrontal activation and fronto-hippocampal connectivity.Hum Brain Mapp. 2014 Apr;35(4):1190-200. doi: 10.1002/hbm.22244. Epub 2013 Feb 13. Hum Brain Mapp. 2014. PMID: 23404764 Free PMC article.
-
When your friends make you cringe: social closeness modulates vicarious embarrassment-related neural activity.Soc Cogn Affect Neurosci. 2016 Mar;11(3):466-75. doi: 10.1093/scan/nsv130. Epub 2015 Oct 29. Soc Cogn Affect Neurosci. 2016. PMID: 26516170 Free PMC article.
-
Revisiting the effective connectivity within the distributed cortical network for face perception.Neuroimage Rep. 2021 Aug 17;1(4):100045. doi: 10.1016/j.ynirp.2021.100045. eCollection 2021 Dec. Neuroimage Rep. 2021. PMID: 40568430 Free PMC article.
-
Age-related changes in parietal lobe activation during an episodic memory retrieval task.J Neural Transm (Vienna). 2013 May;120(5):799-806. doi: 10.1007/s00702-012-0904-x. Epub 2012 Oct 20. J Neural Transm (Vienna). 2013. PMID: 23086222
References
-
- Meyer-Lindenberg A, Weinberger DR. Intermediate phenotypes and genetic mechanisms of psychiatric disorders. Nat Rev Neurosci. 2006;7:818–827. - PubMed
-
- Mier D, Kirsch P, Meyer-Lindenberg A. Neural substrates of pleiotropic action of genetic variation in COMT: a meta-analysis. Mol Psychiatry. 2009;15:918–927. - PubMed
-
- Friston KJ, Frith CD, Liddle PF, Frackowiak RS. Functional connectivity: the principal-component analysis of large (PET) data sets. J Cereb Blood Flow Metab. 1993;13:5–14. - PubMed
Publication types
MeSH terms
LinkOut - more resources
Full Text Sources
Medical
