. 2011;6(12):e28965.
doi: 10.1371/journal.pone.0028965. Epub 2011 Dec 29.

Mitotic spindle orients perpendicular to the forces imposed by dynamic shear

Affiliations

Mitotic spindle orients perpendicular to the forces imposed by dynamic shear

Pablo Fernandez et al. PLoS One. 2011.

Abstract

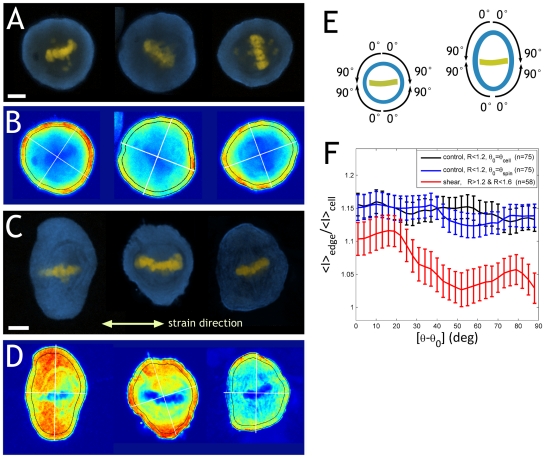
Orientation of the division axis can determine cell fate in the presence of morphogenetic gradients. Understanding how mitotic cells integrate directional cues is therefore an important question in embryogenesis. Here, we investigate the effect of dynamic shear forces on confined mitotic cells. We found that human epithelial cells (hTERT-RPE1) as well as MC3T3 osteoblasts align their mitotic spindle perpendicular to the external force. Spindle orientation appears to be a consequence of cell elongation along the zero-force direction in response to the dynamic shear. This process is a nonlinear response to the strain amplitude, requires actomyosin activity and correlates with redistribution of myosin II. Mechanosteered cells divide normally, suggesting that this mechanism is compatible with biological functions.


Conflict of interest statement

Competing Interests: The authors have declared that no competing interests exist.

Figures

Figure 1
Figure 1. Experimental setup.
A: Shear deformations are used throughout this work to mechanically stimulate cells. Cells are located between two flat substrates separated by a gap h. Cells are sheared by translating one substrate over a distance dy along the strain direction y (keeping the gap constant). The magnitude of the shear strain is given by γ  = dy/h. This geometry does not impose forces along x (the zero-force direction) and keeps cell volume constant. B: Mitotic cells are first harvested by shaking the culture flask, then collected by centrifugation, introduced in the chamber, and allowed to sink onto the bottom plate. Finally the top plate is brought down slowly. As soon as the final gap is reached, the temperature is increased from 25°C to 37°C. C: Experimental set-up. A monolayer of about 1000 cells is sheared between the two glass plates. The gap between the plates can be measured with micrometer accuracy by recording interference fringes with a hand-spectrometer. A flow of fresh medium ensures constant pH and oxygen supply. Coupled with an XY translation stage, the setup can collect data over hundreds of cells.
Figure 2
Figure 2. Sheared mitotic cells elongate along the zero-force direction in an actomyosin-dependent manner.
A: Non-strained cells divide isotropically. Strained RPE1 cells elongate and divide along the zero-force direction. B: RPE1 cell elongation before anaphase onset as a function of amplitude for a constant frequency 3 Hz. C: elongation as a function of frequency for a constant amplitude (100%). Glass plates were not coated in A,B,C. D: Cell elongation is also observed with albumin-passivated as well as with fibronectin-coated glass plates. ROCK inhibition by Y-27632 at a concentration of 10 µM abolishes cell elongation. E: Cell orientation for all plate coatings and ROCK inhibition.
Figure 3
Figure 3. Shear-elongation by 15% suffices to align the mitotic spindle.
Angular difference between the mitotic spindle axis and the major axis of the cell body as a function of cell elongation. Black: non-sheared cells. Green: low frequency 0.03 Hz, large amplitude 100% shear strain. Red: faster frequency 0.3 Hz, large amplitude 100% shear strain. Cells were RPE1 and the glass plates were not coated.
Figure 4
Figure 4. The spindle adapts to time-varying forces via actomyosin.
A: Immediately after increasing the temperature to 37°C, RPE1 cells were stimulated by application of shear force along the X axis at frequency 0.3 Hz and strain amplitude 100%. After 10 min, at time t = 0, the direction of the force was changed by 90 deg from X to Y and the subsequent response of cell shape and spindle orientation was analyzed. B: Immediately after rotation of the external force, control (non-treated) cells became round and subsequently elongated along X. Simultaneously, the mitotic spindle rotated from Y to X. In contrast, cells treated with the ROCK inhibitor Y-27632 neither elongated nor re-oriented the mitotic spindle. Similarly, cells treated with blebbistatin or cytochalasin D did not rotate the spindle (cell shape is ill-defined under these conditions). In contrast, cells treated with vanadate (300 µM) rotated the spindle away from the strain at the same pace as non-treated cells, but often failed to separate chromatides and the spindle collapsed. Note that the cell elongation reached abnormal values, likely due due to the longer time spent in metaphase. C: Spindle angular position (red), cell major axis angular position (black) and cell elongation (green) as a function of time, for a representative subset of 16 non-treated cells. Curves terminate at anaphase onset. D: Average values of 44 cells as a function of time. Data is shown as mean +/− standard deviation. E: Cells treated with Y27632 at a concentration of 10 µM. F: Distribution of spindle rotation speed for different drug treatments. Negative rotation speeds correspond to spindle rotating towards the external strain. Statistical significance relative to the control was assessed using a Mann-Whitney U-test. One asterisk indicates P<0.01, two asterisks indicate P<10−8. Actomyosin inhibition by either Y-27632, blebbistatin, or cytochalasin D all led to significantly slower rotation rates as well as loss of directionality (negative rotation rates). In contrast, vanadate did not have a significant effect on spindle rotation.
Figure 5
Figure 5. Shear-elongated cells have more myosin at the poles.
A: Immunofluorescence images of control (non-sheared) RPE1 cells. Blue is myosin II, yellow is DNA stain. Bar: 5 µm. B: color-coded intensity of myosin stain for the cells shown in A. The white lines mark the position of the major and minor axis as recognized by the algorithm. The outlined perifery region was used to quantify myosin intensity (see fig.F). C: immunofluorescence images of sheared RPE1 cells (amplitude 100% strain, frequency 0.3 Hz). Bar: 5 µm. D: color-coded myosin intensity of the cells shown in C. E: for statistics, we averaged the angular distribution of myosin intensity over several cells (control: n = 75, sheared: n = 58). Since there are no signs of polarity or chirality in the images, we split each cell into four quadrants and averaged the data over them. For the reference angle θ0 we considered two possibilities, the cell body orientation and the chromosome plate orientation. F: mean myosin signal intensity throughout the perifery as a function of angle θ-θ0, normalized by the mean intensity over the whole cell body. In the case of the control cells, we analyzed the results using two different reference angles: the orientation of the cell body (θ0 = θcell, black curve) and the orientation of the spindle (θ0 = θspin, blue curve). For sheared cells (red curve) this distinction play no role, since the difference between the two orientations is at most 20 deg. Normalized intensities were averaged over multiple cells, as well as over the four quadrants of each cell by reflecting about θ0 and θ0 + 90 deg (see E). Error bars denote +/− 2 S.E. Control cells showed an essentially flat signal, regardless whether we took the cell body or the spindle as reference. In contrast, sheared cells showed more myosin intensity around the poles (θ = θ0) than close to the equatorial plane.
Figure 6
Figure 6. Shear forces orient the division axis without compromising mitosis.
A: Division angle distributions for different amplitudes (vertical axis on the left) and frequencies (horizontal axis at the bottom) for RPE1 cells. At small amplitudes (γ = 10%), anisotropic division requires a very high frequency (30 Hz). At large amplitudes (γ = 100%), even very slow stimulations (0.03 Hz) suffice to align the division axis in essentially all cells. Statistical significance relative to the control was assessed using a Mann-Whitney U-test on the reflected angles | θ - 90° |. One asterisk indicates P<0.01, two asterisks indicate P<10−8. B: Similar results were obtained with the osteoblast cell line MC3T3. C: Cumulative histograms of anaphase onset times in the presence of dynamic forces for RPE1 cells. Each curve is a different experiment, performed at varying amplitudes and the same frequency 3 Hz. D: Cumulative histograms of anaphase onset times of RPE1 cells for different frequencies and constant large amplitude 100%. Strain-alignment of the division axis (which is observed for all frequencies at this amplitude) delays division only marginally. A significant delay is observed at 3 Hz; note that cell division becomes again fast at 30 Hz. E: RPE1 cell growth after force-alignment of the spindle. After each experiment, cells were collected, plated on a gridded dish (Ibidi, Munich, Germany) and the growth of individual cells was followed over three days. Note that cells are synchronized by shake-off prior to the experiment and re-seeded afterwards. After one day, cells grow exponentially. To ease comparison of the exponential growth phase between different treatments, we divided cell number by its value at day 1. For a control, we followed also the growth of cells that had been in normal culture conditions throughout (black dashed line). No significant difference in growth rate can be observed after mechanical stimulation at 0.03 Hz, 100%. Nevertheless, we observed increased cell death within the first day following stimulation at 3 Hz, 100%, probably indicating damage by the non-physiological stimulation.

References

    1. Fishkind DJ, Wang YL. New Horizons for Cytokinesis. Current Opinion in Cell Biology. 1995;7:23–31. - PubMed
    1. Gachet Y, Tournier S, Millar JB, Hyams JS. Mechanism controlling perpendicular alignment of the spindle to the axis of cell division in fission yeast. Embo Journal. 2004;23:1289–1300. - PMC - PubMed
    1. Betschinger J, Knoblich JA. Dare to be different: Asymmetric cell division in Drosophila, C-elegans and vertebrates. Current Biology. 2004;14:R674–R685. - PubMed
    1. Strauss B, Adams RJ, Papalopulu N. A default mechanism of spindle orientation based on cell shape is sufficient to generate cell fate diversity in polarised Xenopus blastomeres. Development. 2006;133:3883–3893. - PubMed
    1. Siller KH, Doe CQ. Spindle orientation during asymmetric cell division. Nature Cell Biology. 2009;11:365–374. - PubMed

Publication types