Do regional modifications in tissue mineral content and microscopic mineralization heterogeneity adapt trabecular bone tracts for habitual bending? Analysis in the context of trabecular architecture of deer calcanei
- PMID: 22220639
- PMCID: PMC3381618
- DOI: 10.1111/j.1469-7580.2011.01470.x
Do regional modifications in tissue mineral content and microscopic mineralization heterogeneity adapt trabecular bone tracts for habitual bending? Analysis in the context of trabecular architecture of deer calcanei
Abstract
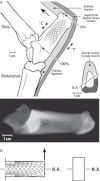
Calcanei of mature mule deer have the largest mineral content (percent ash) difference between their dorsal 'compression' and plantar 'tension' cortices of any bone that has been studied. The opposing trabecular tracts, which are contiguous with the cortices, might also show important mineral content differences and microscopic mineralization heterogeneity (reflecting increased hemi-osteonal renewal) that optimize mechanical behaviors in tension vs. compression. Support for these hypotheses could reveal a largely unrecognized capacity for phenotypic plasticity - the adaptability of trabecular bone material as a means for differentially enhancing mechanical properties for local strain environments produced by habitual bending. Fifteen skeletally mature and 15 immature deer calcanei were cut transversely into two segments (40% and 50% shaft length), and cores were removed to determine mineral (ash) content from 'tension' and 'compression' trabecular tracts and their adjacent cortices. Seven bones/group were analyzed for differences between tracts in: first, microscopic trabecular bone packets and mineralization heterogeneity (backscattered electron imaging, BSE); and second, trabecular architecture (micro-computed tomography). Among the eight architectural characteristics evaluated [including bone volume fraction (BVF) and structural model index (SMI)]: first, only the 'tension' tract of immature bones showed significantly greater BVF and more negative SMI (i.e. increased honeycomb morphology) than the 'compression' tract of immature bones; and second, the 'compression' tracts of both groups showed significantly greater structural order/alignment than the corresponding 'tension' tracts. Although mineralization heterogeneity differed between the tracts in only the immature group, in both groups the mineral content derived from BSE images was significantly greater (P < 0.01), and bulk mineral (ash) content tended to be greater in the 'compression' tracts (immature 3.6%, P = 0.03; mature 3.1%, P = 0.09). These differences are much less than the approximately 8% greater mineral content of their 'compression' cortices (P < 0.001). Published data, suggesting that these small mineralization differences are not mechanically important in the context of conventional tests, support the probability that architectural modifications primarily adapt the tracts for local demands. However, greater hemi-osteonal packets in the tension trabecular tract of only the mature bones (P = 0.006) might have an important role, and possible synergism with mineralization and/or microarchitecture, in differential toughening at the trabeculum level for tension vs. compression strains.
© Published 2012. This article is a US Government work and is in the public domain in the USA. Journal of Anatomy © 2012 Anatomical Society.
Figures


References
-
- Anderson AE. Mule and Black-Tailed Deer of North America. Lincoln, NE: University of Nebraska Press; 1981. Morphologic and Physiological Characteristics; pp. 27–97. Chapter 2.
-
- Banks WJ, Glenwood PE, Kainer RA. Antler growth and osteoporosis: morphological and morphometric changes in the costal compacta during the antler growth cycle. Anat Rec. 1968;162:387–398. - PubMed
-
- Barak MM, Lieberman DE, Hublin JJ. A Wolff in sheep's clothing: trabecular bone adaptation in response to changes in joint loading orientation. Bone. 2011;49:1141–1151. - PubMed
-
- Bay BK, Yerby SA, McLain RF, et al. Measurement of strain distributions within vertebral body sections by texture correlation. Spine (Phila Pa 1976) 1999;24:10–17. - PubMed
-
- Bayraktar HH, Morgan EF, Niebur GL, et al. Comparison of the elastic and yield properties of human femoral trabecular and cortical bone tissue. J Biomech. 2004;37:27–35. - PubMed
Publication types
MeSH terms
LinkOut - more resources
Full Text Sources
Medical
Research Materials
Miscellaneous

