. 2012 Jul 1;17(1):11-21.
doi: 10.1089/ars.2011.4363.

Inhaled hydrogen sulfide prevents endotoxin-induced systemic inflammation and improves survival by altering sulfide metabolism in mice

Affiliations

Inhaled hydrogen sulfide prevents endotoxin-induced systemic inflammation and improves survival by altering sulfide metabolism in mice

Kentaro Tokuda et al. Antioxid Redox Signal. .

Abstract

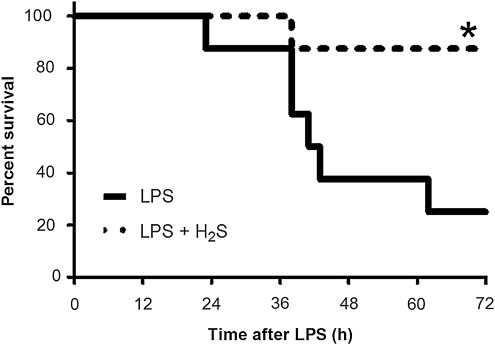
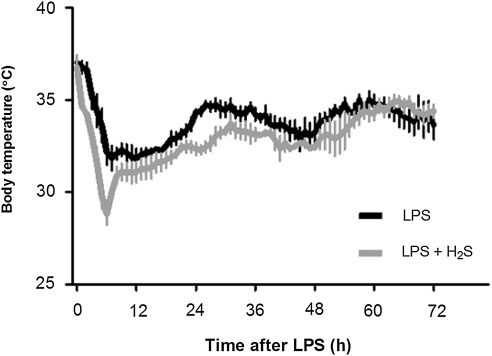
Aims: The role of hydrogen sulfide (H(2)S) in endotoxin (lipopolysaccharide [LPS])-induced inflammation is incompletely understood. We examined the impact of H(2)S breathing on LPS-induced changes in sulfide metabolism, systemic inflammation, and survival in mice.

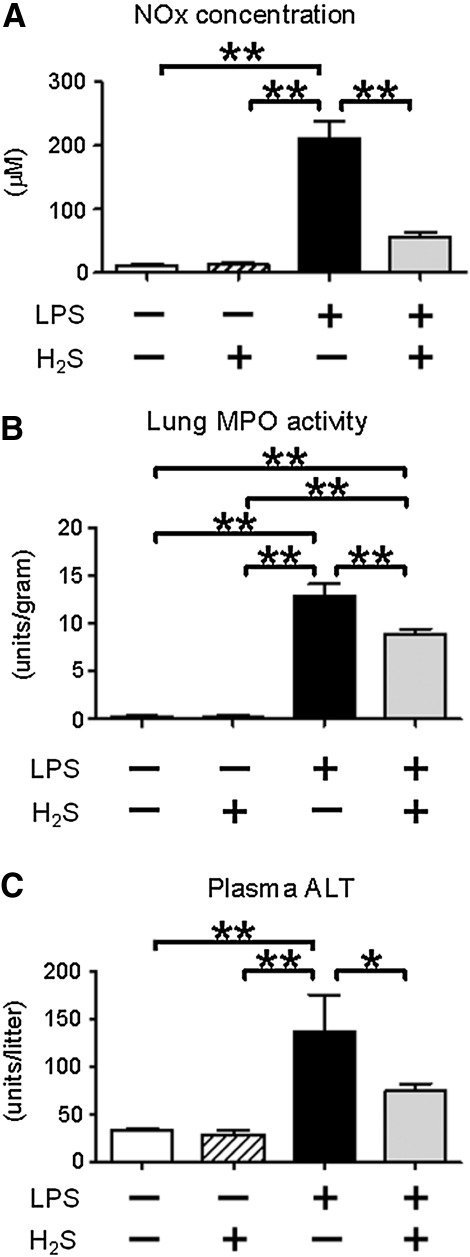
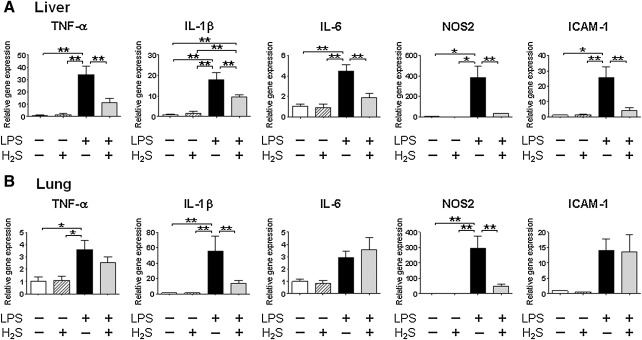
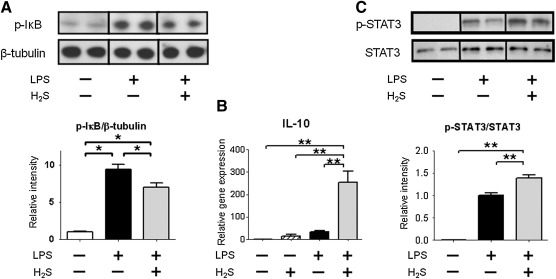
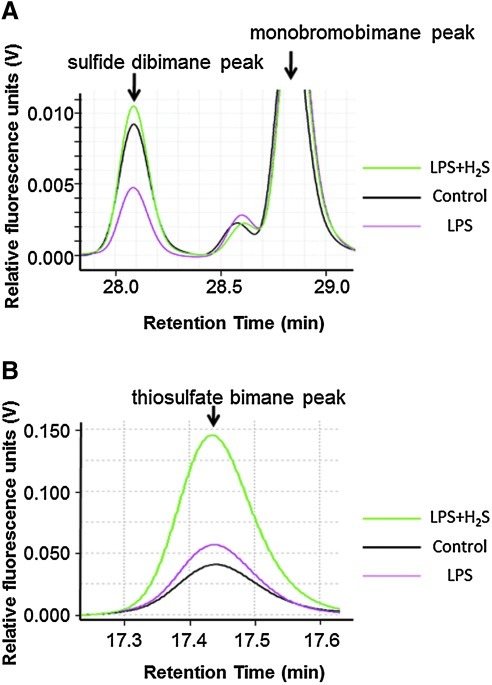
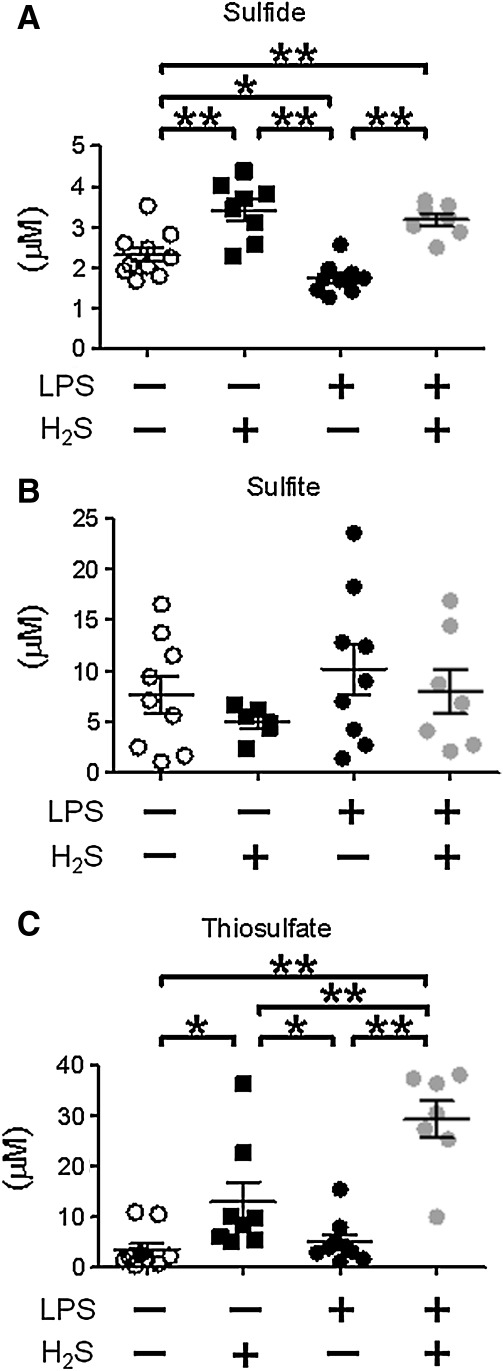
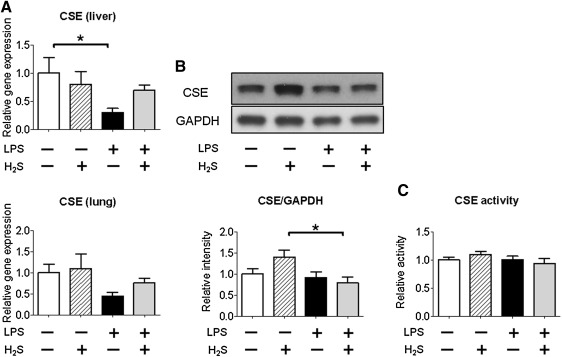
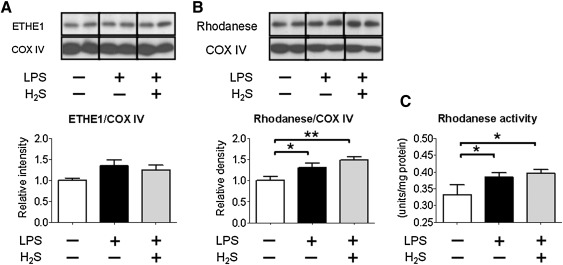
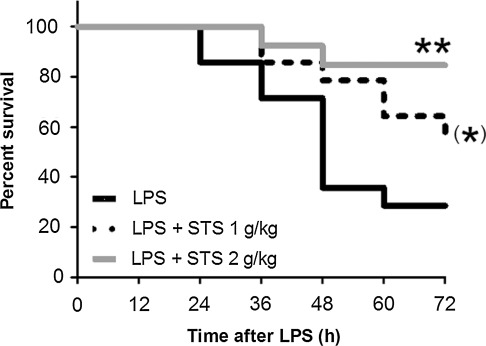
Results: Mice that breathed air alone exhibited decreased plasma sulfide levels and poor survival rate at 72 h after LPS challenge. Endotoxemia markedly increased alanine aminotransferase (ALT) activity and nitrite/nitrate (NOx) levels in plasma and lung myeloperoxidase (MPO) activity in mice that breathed air. In contrast, breathing air supplemented with 80 ppm of H(2)S for 6 h after LPS challenge markedly improved survival rate compared to mice that breathed air alone (p<0.05). H(2)S breathing attenuated LPS-induced increase of plasma ALT activity and NOx levels and lung MPO activity. Inhaled H(2)S suppressed LPS-induced upregulation of inflammatory cytokines, while it markedly induced anti-inflammatory interleukin (IL)-10 in the liver. Beneficial effects of H(2)S inhalation after LPS challenge were associated with restored sulfide levels and markedly increased thiosulfate levels in plasma. Increased thiosulfate levels after LPS challenge were associated with upregulation of rhodanese, but not cystathionine-γ-lyase (CSE), in the liver. Administration of sodium thiosulfate dose-dependently improved survival after LPS challenge in mice.

Innovation: By measuring changes in plasma levels of sulfide and sulfide metabolites using an advanced analytical method, this study revealed a critical role of thiosulfate in the protective effects of H(2)S breathing during endotoxemia.

Conclusion: These observations suggest that H(2)S breathing prevents inflammation and improves survival after LPS challenge by altering sulfide metabolism in mice.


Figures

FIG. 1.
FIG. 1.
Kaplan-Meier curve showing survival after LPS challenge followed by 6 h inhalation of air with or without H2S (80 ppm). LPS, mice challenged with LPS and breathed air alone (n=8); LPS+H2S, mice challenged with LPS and breathed air supplemented with 80 ppm H2S (n=6); *p=0.0161 vs. LPS.
FIG. 2.
FIG. 2.
Change of body temperature in mice after LPS challenge followed by 6 h inhalation of air with or without H2S at 25°C ambient temperature measured with radiotelemetry devices. Mean body temperature±SEM are shown in mice that were challenged with LPS and breathed air alone (LPS, n=5) and mice that were challenged with LPS and breathed air supplemented with 80 ppm of H2S (LPS+H2S, n=4).
FIG. 3.
FIG. 3.
Effects of H2S and/or LPS on plasma NOx levels, lung MPO activity, and plasma ALT activity. Plasma NOx levels (A), MPO activity (B), and plasma ALT activity (C) were measured at 6 h (plasma NOx and lung MPO) or 24 h (plasma ALT) after saline or LPS challenge without or with H2S breathing. N=3–7 in each group; *p<0.05, **p<0.01.
FIG. 4.
FIG. 4.
Effects of H2S and/or LPS on gene expression levels of inflammatory mediators. Relative gene expression levels of inflammatory mediators in the liver (A) and lung (B) were measured at 6 h after saline or LPS challenge without or with H2S breathing. Gene expression was normalized to 18S rRNA expression level, and the mean value for mice challenged with saline and breathed air alone was set to 1. N=3-8 in each group; *p<0.05, **p<0.01.
FIG. 5.
FIG. 5.
Effects of H2S and/or LPS on phosphorylated IκB, gene expression of IL-10, and phosphorylated STAT3. (A) Representative immunoblot and densitometric analysis of phosphorylated IκB (p-IκB) protein expression in the liver at 1 h after LPS challenge. Relative intensity was normalized to β-tubulin expression level, and the mean value for mice challenged with saline and breathed air alone was set to 1. (B) Relative gene expression level of IL-10 in the liver at 6 h after challenge with saline or LPS challenge without or with H2S breathing. Gene expression was normalized to 18S rRNA expression level, and the mean value for mice challenged with saline and breathed air alone was set to 1. (C) Representative immunoblot and densitometric analysis of phosphorylated STAT3 (p-STAT3) protein expression in the liver nuclear extracts at 1 h after LPS challenge. Relative intensity was normalized to STAT3 expression level, and the mean value for mice challenged with LPS and breathed air alone was set to 1. N=6–10 in each group; *p<0.05, **p<0.01.
FIG. 6.
FIG. 6.
Representative traces of HPLC spectra of sulfide dibimane and monobromobimane (A) and thiosulfate bimane (B) in plasma. Control (black line), mice challenged with saline and breathed air alone; LPS (red line), mice challenged with LPS and breathed air alone; LPS+H2S (green line), mice challenged with LPS and breathed air supplemented with H2S. (To see this illustration in color the reader is referred to the web version of this article at www.liebertonline.com/ars).
FIG. 7.
FIG. 7.
Effects of H2S and/or LPS on plasma sulfide, sulfite, and thiosulfate levels. Plasma sulfide (A), sulfite (B), and thiosulfate (C) levels were measured at 6h after challenge with saline or LPS without or with H2S breathing. N=6–10 in each group; *P<0.05, **P<0.01.
Fig. 8.
Fig. 8.
Effects of H2S and/or LPS on CSE gene and protein expression and activity. (A) Relative gene expression levels of CSE in the liver and lung at 6 h after challenge with saline or LPS without or with H2S breathing. Gene expression was normalized to 18S rRNA expression level, and the mean value for mice challenged with saline and breathed air alone was set to 1. N=3–7 in each group. (B) Representative immunoblot and densitometric analysis of CSE protein expression in the liver at 6 h after challenge with saline or LPS without or with H2S breathing. Relative intensity was normalized to GAPDH expression level, and the mean value for mice challenged with saline and breathed air alone was set to 1. N=6 in each group. (C) CSE activity in the liver at 6 h after challenge with saline or LPS without or with H2S breathing. CSE activity was normalized to protein concentration, and the mean value for mice challenged with saline and breathed air alone was set to 1. N=5–8 in each group; *P<0.05, **P<0.01.
FIG. 9.
FIG. 9.
Effects of H2S and/or LPS on protein expression of ETHE1 and rhodanese and activity of rhodanese. (A) Representative immunoblots and densitometric analyses of ETHE1 and rhodanese (B) in the liver at 6 h after saline or LPS challenge without or with H2S breathing. Relative intensity was normalized to COX IV expression level and the mean value for mice challenged with saline and breathed air alone was set to 1. N=7–10 in each group. (C) Rhodanese activity in the liver at 6 h after saline or LPS challenge without or with H2S breathing. Rhodanese activity was normalized to protein concentration. N=7–10 in each group; *p<0.05, **p<0.01.
FIG. 10.
FIG. 10.
Kaplan-Meier curve showing survival in mice challenged with LPS (LPS, n=14), mice challenged with LPS and received 1 g/kg of STS (LPS+STS 1 g/kg, n=14), and mice challenged with LPS and received 2 g/kg of STS (LPS+STS 2 g/kg, n=13). **p=0.0047 vs. LPS; (*)p=0.0781 vs. LPS.

References

    1. Cheng F. Xie S. Guo M. Fang H. Li X. Yin J. Lu G. Li Y. Ji X. Yu S. Altered glucose metabolism and preserved energy charge and neuronal structures in the brain of mouse intermittently exposed to hypoxia. J Chem Neuroanat. 2011;42:65–71. - PubMed
    1. Doeller JE. Isbell TS. Benavides G. Koenitzer J. Patel H. Patel RP. Lancaster JR., Jr. Darley-Usmar VM. Kraus DW. Polarographic measurement of hydrogen sulfide production and consumption by mammalian tissues. Anal Biochem. 2005;341:40–51. - PubMed
    1. Ebong S. Call D. Nemzek J. Bolgos G. Newcomb D. Remick D. Immunopathologic alterations in murine models of sepsis of increasing severity. Infect and Immun. 1999;67:6603–6610. - PMC - PubMed
    1. Hayden MR. Goldsmith DJA. Sodium thiosulfate: New hope for the treatment of calciphylaxis. Semin Dial. 2010;23:258–262. - PubMed
    1. Hellman J. Roberts JD., Jr. Tehan MM. Allaire JE. Warren HS. Bacterial peptidoglycan-associated lipoprotein is released into the bloodstream in gram-negative sepsis and causes inflammation and death in mice. J Biol Chem. 2002;277:14274–14280. - PubMed

Publication types

MeSH terms