. 2012 Jun;166(3):1018-32.
doi: 10.1111/j.1476-5381.2012.01824.x.

Thiazolidinedione-dependent activation of sphingosine kinase 1 causes an anti-fibrotic effect in renal mesangial cells

Affiliations

Thiazolidinedione-dependent activation of sphingosine kinase 1 causes an anti-fibrotic effect in renal mesangial cells

A Koch et al. Br J Pharmacol. 2012 Jun.

Abstract

Background and purpose: PPARγ agonists [thiazolidinediones (TZDs)] are known to exert anti-fibrotic effects in the kidney. In addition, we previously demonstrated that sphingosine kinase 1 (SK-1) and intracellular sphingosine-1-phosphate (S1P), by reducing the expression of connective tissue growth factor (CTGF), have a protective role in the fibrotic process.

Experimental approach: Here, we investigated the effect of TZDs on intracellular sphingolipid levels and the transcriptional regulation of SK-1 in mesangial cells to evaluate potential novel aspects of the anti-fibrotic capacity of TZDs.

Key results: Stimulation with the TZDs, troglitazone and rosiglitazone, led to increased S1P levels in rat mesangial cells. This was paralleled by increased SK-1 activity as a consequence of direct effects of the TZDs on SK-1 expression. GW-9662, a PPARγ antagonist, inhibited the stimulating effect of TZDs on SK-1 mRNA and activity levels and intracellular S1P concentrations. Furthermore, SK-1 up-regulation by TZDs was functionally coupled with lower amounts of pro-fibrotic CTGF. SK-1 inhibition with SKI II almost completely abolished this effect in a dose-dependent manner. Moreover, the CTGF lowering effect of TZDs was fully blocked in MC isolated from SK-1 deficient mice (SK-1(-/-) ) as well as in glomeruli of SK-1(-/-) mice compared with wild-type mice treated with TRO and RSG.

Conclusion and implications: These data show that TZD-induced SK-1 up-regulation results in lower amounts of CTGF, demonstrating novel facets for the anti-fibrotic effects of this class of drugs.


Figures

Figure 1
Figure 1
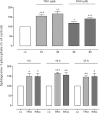
Effect of TRO and RSG on cellular S1P levels in rat MCs. Quiescent cells were stimulated for 24 h with the indicated concentrations of TRO and RSG (upper panel) or for the indicated time points with 20 µM TRO and 50 µM RSG (lower panel). Lipid concentrations were measured using LC/MS/MS as described in the Methods section. S1P levels in treated cells are shown relative to control cells [vehicle alone; co, S1P conc. ± SEM = 2.59 ± 0.36 ng·mg−1 protein]. Values are means ± SEM (n= 4–5). *P < 0.05, **P < 0.01, ***P < 0.001, compared with the respective control cells.
Figure 2
Figure 2
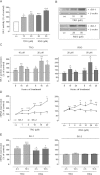
Effect of TRO and RSG on SK-1 activity (A) and protein (B, C) and mRNA (D, E) expression in rat MCs. (A) Quiescent cells were stimulated for 16 h with the indicated concentrations of TRO and RSG. Thereafter, cell lysates containing equal amounts of proteins were taken for in vitro SK-1 activity assays as described in the Methods section. Data are shown relative to control cells (vehicle alone; co). (B, C) Quiescent cells were stimulated for 16 h (B) or for the indicated time points (C) with either vehicle or the indicated concentrations of TRO and RSG. Thereafter, cell lysates were processed for Western blot analysis using specific antibodies against rat SK-1 at a dilution of 1:1000, or β-actin at a dilution of 1:3000. Bands corresponding to SK-1 and β-actin in treated cells were densitometrically evaluated and are shown relative to control cells (vehicle alone; dashed lines). Western blot data in (B) are representative of three independent experiments giving similar results. (D, E) Quiescent cells were stimulated for 8 h with the indicated concentrations of TRO and RSG (D); or with either vehicle or 10 µM of TRO and 20 µM of RSG for the indicated time periods (E). Thereafter, total RNA was extracted from cells and mRNA expression levels were determined by real-time detection RT-PCR (TaqMan®) analysis using GAPDH mRNA expression levels for normalization. mRNA expression levels of SK-1 and SK-2 in the treated cells are shown relative to control cells [vehicle alone; dashed lines (E)]. All values are means ± SEM (n= 4–6). *P < 0.05, **P < 0.01, ***P < 0.001, compared with the respective control cells.
Figure 3
Figure 3
Effect of TRO and RSG on SK-1 mRNA (A) and protein expression (B, C) in human MCs. Quiescent cells were stimulated for 16 h with 20 µM TRO and RSG (A) or with the indicated concentrations (B, C) of TRO and RSG. (A) Thereafter, total RNA was extracted from cells and SK-1 mRNA expression levels were determined by real-time detection RT-PCR (TaqMan®) analysis using GAPDH mRNA expression levels for normalization. mRNA expression levels of SK-1 in the treated cells are shown relative to control cells (vehicle alone; co). Values are means ± SEM (n= 3). (B, C) Cell lysates were processed for Western blot analysis using specific antibodies against human SK-1 at a dilution of 1:1000, or β-actin at a dilution of 1:3000. Bands corresponding to SK-1 and β-actin in treated cells were densitometrically evaluated and are shown relative to control cells (co). Western blot data in (B) are representative of three independent experiments giving similar results. All values are means ± SEM (n= 4). *P < 0.05, **P < 0.01, ***P < 0.001, compared with the respective control cells.
Figure 4
Figure 4
Effect of TRO and RSG on SK-1 mRNA (A) and SK-1 protein expression (B, C) in mouse glomeruli and mouse MCs (D, E). (A–C) C57BL/6NCrl mice were treated with either vehicle or with 15 mg·mg−1 body weight TRO and RSG once by gavage. After 24 h kidneys were harvested and taken for isolation of glomeruli by using a differential sieving method. (A) Total RNA was extracted and mRNA expression levels were determined by real time detection RT-PCR (TaqMan®) analysis using GAPDH mRNA expression levels for normalization. mRNA expression levels of SK-1 in the treated groups are shown relative to control group (co). (B, C) Protein lysates of mouse glomeruli were processed for Western blot analysis using specific antibodies against mouse SK-1 at a dilution of 1:1000 or β-actin at a dilution of 1:3000. Bands corresponding to CTGF and β-actin in the treated groups were densitometrically evaluated and are shown relative to control group (co, vehicle alone). (C) Western blots specific for SK-1 mice are shown for 3 mice per group. (C, D) Quiescent mouse MCs were stimulated for 16 h with either vehicle or 20 µM TRO and 50 µM RSG. Cell lysates were processed for Western blot analysis as described earlier. Western blot data in (D) are representative of three independent experiments giving similar results. Bands corresponding to SK-1 and β-actin in either treated groups cells were densitometrically evaluated and are shown relative to control group or cells (co, vehicle alone). All values are means ± SEM [n= 8 per group (A, B); n= 3 (D)]. *P < 0.05, **P < 0.01, ***P < 0.001, compared with the respective controls.
Figure 5
Figure 5
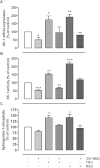
Inhibitory effect of the PPARγ antagonist GW-9662 on TRO and RSG induced increase in mRNA expression (A), SK-1 activity (B) and S1P levels (C) in rat MCs. Quiescent cells were pretreated for 4 h with GW-9662 (20 µM) and then stimulated for 16 h with TRO [10 (A, B) or 20 (C) µM) and RSG (20 (A, B) or 50 (C) µM]. (A) Thereafter, total RNA was extracted from cells and mRNA expression levels were determined by real-time detection RT-PCR (TaqMan®) analysis using GAPDH mRNA expression levels for normalization. (B) Cell lysates were taken for in vitro SK-1 activity assays as described in the Methods section. Data are shown relative to control cells (vehicle alone; co). (C) Thereafter, S1P concentrations were measured using LC/MS/MS as described in the Methods section. Sphingolipid levels in treated cells are shown relative to control cells (vehicle alone; co). All values are means ± SEM (n= 3). *P < 0.05, **P < 0.01, ***P < 0.001, compared with the respective control cells.
Figure 6
Figure 6
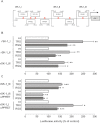
Effect of TRO and RSG on SK-1 promoter activity. (A) Schematic representation of the seven putative PPAR response elements (PPREs) in the rat SK-1 promoter. NRK cells were transfected with DNA containing the different rat SK-1 promoter fragments without (B) and with mutations of PPRE7 (C) as described in the Methods section. Quiescent cells were stimulated for 16 h with 20 µM TRO and 50 µM RSG. The ratio between firefly and Renilla luciferase activities was calculated. Results are expressed as percentage of control cells (vehicle alone; co). All values are means ± SEM (n= 4–5). *P < 0.05, **P < 0.01, compared with the respective control cells.
Figure 7
Figure 7
Binding of nuclear extracts from rat MC treated for 16 h with 20 µM TRO and 50 µM RSG to PPRE7 of rat SK-1 promoter using DIG-labelled oligonucleotides corresponding to either wild-type (PPRE7; lanes 2–5) or mutated PPRE7 (ΔPPRE7; lanes 7–9). After treatment of quiescent cells with TZDs and the subsequent preparation of nuclear extracts, an electrophoretic mobility shift assay was performed using 5 µg of the nuclear extracts and 0.4 ng DIG-labelled probes (lanes 1 and 6, free probes; lanes 2 and 7, vehicle alone; lanes 4 and 8, 20 µM TRO, lanes 5 and 9, 50 µM RSG). A competitive assay with the addition of 20-fold unlabelled PPRE7 oligonucleotide was used as control for non-specific binding (lane 3). Representative data of two independent experiments are shown.
Figure 8
Figure 8
Effect of TRO and RSG on CTGF protein expression in rat, human and mouse MCs. (A, B) Quiescent rat (A) and human (B) cells were stimulated for 16 h with the indicated concentrations of TRO and RSG. Thereafter, supernatants were taken for protein precipitation using trichloroacetic acid and for the determination of secreted CTGF protein by Western blot analysis using an antibody against CTGF at a dilution of 1:1000. Corresponding cell lysates were taken for β-actin analysis. (C) Quiescent mouse MCs isolated from C57BL/6 mice were stimulated for 16 h with either vehicle, 20 µM TRO or 50 µM RSG. Lysates were processed for Western blot analysis using an antibody against CTGF and β-actin as described earlier. Representative CTGF Western blot data of three independent experiments are shown (the corresponding mouse SK-1 data are shown in Figure 4E).
Figure 9
Figure 9
Effect of TGFβ, TRO and RSG on CTGF protein expression under SK-1 inhibitory conditions in rat MCs. (A) Quiescent cells were pre-incubated for 1 h with SK-1 inhibitor II (SKI II) and stimulated for 24 h with the indicated concentration of TGFβ. (B, C) Quiescent cells were stimulated in parallel for 16 h with either 20 µM TRO or 50 µM RSG and the indicated concentrations of SKI II. After all experiments, supernatants were taken for protein precipitation using trichloroacetic acid and for the determination of secreted CTGF protein by Western blot analysis using an antibody against CTGF at a dilution of 1:1000. (A, C) Corresponding cell lysates were taken for β-actin analysis. (C) Bands corresponding to CTGF and β-actin in treated cells were densitometrically evaluated and are shown relative to control cells (co, vehicle alone). All Western blot data are representative of three to four independent experiments giving similar results. All values are means ± SEM (n= 4). *P < 0.05, **P < 0.01, ***P < 0.001, compared with the respective control cells (co). #P < 0.05 compared with the TRO and RSG treated cells as indicated.
Figure 10
Figure 10
Effect of TRO and RSG on CTGF protein expression in wild-type and SK-1 deficient (SK-1−/−) mouse MCs. Cells isolated from either wild-type C57BL/6 mice or SK-1−/− mice were treated for 16 h with either vehicle, 20 µM TRO or 50 µM RSG. Thereafter, supernatants were taken for protein precipitation using trichloroacetic acid and for the determination of secreted CTGF protein by Western blot analysis using an antibody against CTGF at a dilution of 1:1000. The corresponding cell lysates were taken for β-actin (1:3000) analysis. (A) Bands corresponding to CTGF and β-actin in treated cells were densitometrically evaluated and are shown relative to control cells (co, vehicle alone). (B) All Western blot pictures are representative of three independent experiments giving similar results. All values are means ± SEM (n= 3–4). **P < 0.01, ***P < 0.001, compared with the wild-type control cells (A; co).
Figure 11
Figure 11
Effect of TRO and RSG on CTGF protein expression in mouse glomeruli. Wild-type C57BL/6NCrl and SK-1 deficient (SK-1−/−) mice were treated with either vehicle, or 15 mg·kg−1 body weight TRO or RSG once by gavage. After 24 h kidneys were harvested and taken for isolation of glomeruli by using a differential sieving method. Protein lysates of mouse glomeruli were processed for Western blot analysis using specific antibodies against mouse CTGF at a dilution of 1:1000 or β-actin at a dilution of 1:3000. Bands corresponding to CTGF and β-actin in the treated groups were densitometrically evaluated and are shown relative to control group (co, vehicle alone). Values are means ± SEM (n= 8 per group for wild-type; n= 3 per group for SK-1−/−). **P < 0.01, compared with the respective controls. Representative Western blot data specific for CTGF in wild-type mice are shown (The corresponding SK-1 data are shown in Figure 4C). SK-1−/− CTGF Western blot data are shown for three mice per group.
Figure 12
Figure 12
Schematic overview of the suggested link between PPARγ agonists, SK-1 expression and activity, intracellular S1P generation and CTGF expression in MCs.

Similar articles

Cited by

References

    1. Abdel Wahab N, Mason RM. Connective tissue growth factor and renal diseases: some answers, more questions. Curr Opin Nephrol Hypertens. 2004;13:53–58. - PubMed
    1. Alvarez SE, Harikumar KB, Hait NC, Allegood J, Strub GM, Kim EY, et al. Sphingosine-1-phosphate is a missing cofactor for the E3 ubiquitin ligase TRAF2. Nature. 2010;465:1084–1088. - PMC - PubMed
    1. Boor P, Sebeková K, Ostendorf T, Floege J. Treatment targets in renal fibrosis. Nephrol Dial Transplant. 2007;22:3391–3407. - PubMed
    1. Bork P. The modular architecture of a new family of growth regulators related to connective tissue growth factor. FEBS Lett. 1993;327:125–130. - PubMed
    1. Chien W, Yin D, Gui D, Mori A, Frank JM, Said J, et al. Suppression of cell proliferation and signaling transduction by connective tissue growth factor in non-small cell lung cancer cells. Mol Cancer Res. 2006;4:591–598. - PubMed

Publication types

MeSH terms