

Visualization and identification of health space, based on personalized molecular phenotype and treatment response to relevant underlying biological processes
- PMID: 22221319
- PMCID: PMC3271030
- DOI: 10.1186/1755-8794-5-1
Visualization and identification of health space, based on personalized molecular phenotype and treatment response to relevant underlying biological processes
Abstract
Background: Being able to visualize multivariate biological treatment effects can be insightful. However the axes in visualizations are often solely defined by variation and thus have no biological meaning. This makes the effects of treatment difficult to interpret.
Methods: A statistical visualization method is presented, which analyses and visualizes the effects of treatment in individual subjects. The visualization is based on predefined biological processes as determined by systems-biological datasets (metabolomics proteomics and transcriptomics). This allows one to evaluate biological effects depending on shifts of either groups or subjects in the space predefined by the axes, which illustrate specific biological processes. We built validated multivariate models for each axis to represent several biological processes. In this space each subject has his or her own score on each axis/process, indicating to which extent the treatment affects the related process.
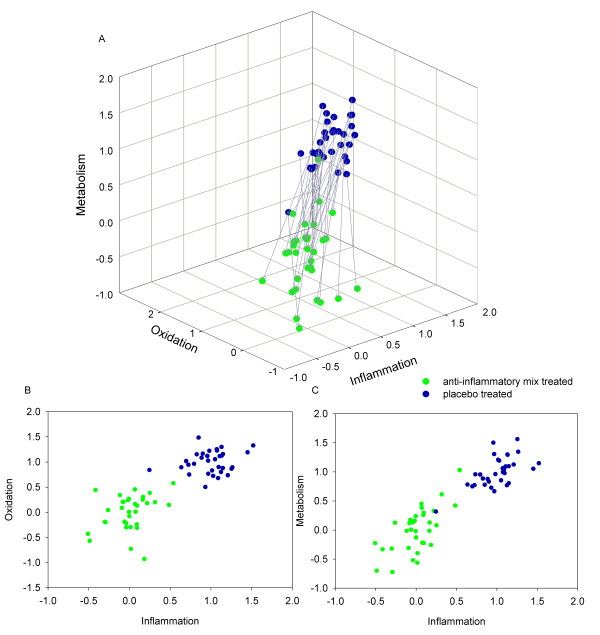
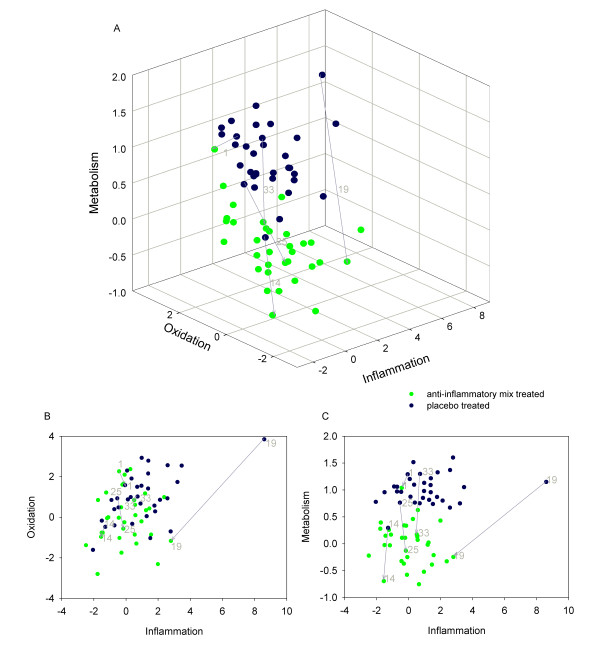
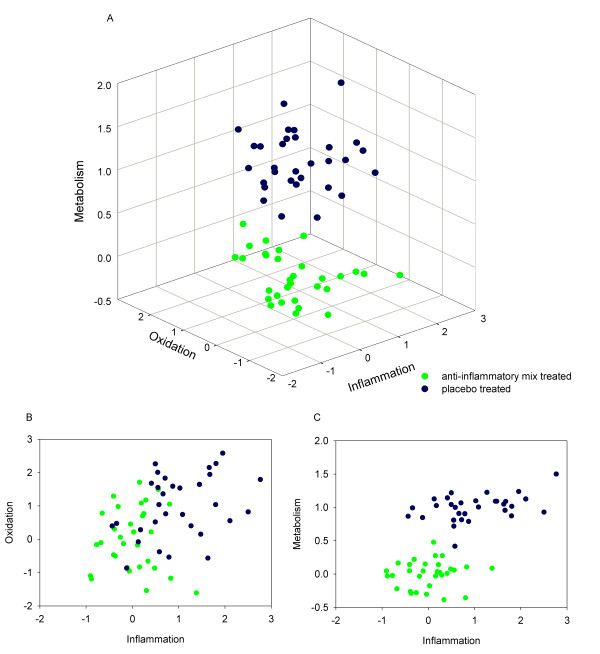
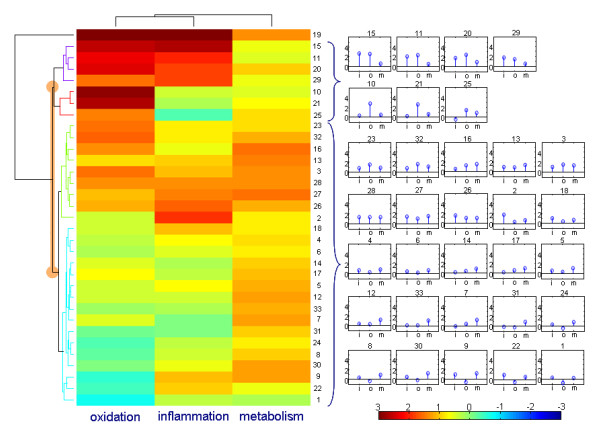
Results: The health space model was applied to visualize the effects of a nutritional intervention, with the goal of applying diet to improve health. The model was therefore named the 'health space' model. The 36 study subjects received a 5-week dietary intervention containing several anti-inflammatory ingredients. Plasma concentrations of 79 proteins and 145 metabolites were quantified prior to and after treatment. The principal processes modulated by the intervention were oxidative stress, inflammation, and metabolism. These processes formed the axes of the 'health space'. The approach distinguished the treated and untreated groups, as well as two different response subgroups. One subgroup reacted mainly by modulating its metabolic stress profile, while a second subgroup showed a specific inflammatory and oxidative response to treatment.
Conclusions: The 'health space' model allows visualization of multiple results and to interpret them. The model presents treatment group effects, subgroups and individual responses.
Figures
References
-
- Holmes E, Loo RL, Stamler J, Bictash M, Yap IK, Chan Q, Ebbels T, De Iorio M, Brown IJ, Veselkov KA, Daviglus ML, Kesteloot H, Ueshima H, Zhao L, Nicholson JK, Elliott P. Human metabolic phenotype diversity and its association with diet and blood pressure. Nature. 2008;453:396–400. doi: 10.1038/nature06882. - DOI - PMC - PubMed
-
- van Ommen B, Fairweather-Tait S, Freidig A, Kardinaal A, Scalbert A, Wopereis S. A network biology model of micronutrient related health. Br J Nutr. 2008;99(Suppl 3):S72–S80. S72-80. - PubMed
-
- Jolliffe IT. Principal Component Analysis. 1986.
-
- Martens H, Naes T. Multivariate Calibration. 1989.
-
- van Erk MJ, Krul CA, Caldenhoven E, Stierum RH, Peters WH, Woutersen RA, van Ommen B. Expression profiling of colon cancer cell lines and colon biopsies: towards a screening system for potential cancer-preventive compounds. Eur J Cancer Prev. 2005;14:439–457. doi: 10.1097/01.cej.0000174781.51883.21. - DOI - PubMed
Publication types
MeSH terms
Substances
LinkOut - more resources
Full Text Sources
Other Literature Sources
