. 2012 Apr;13(4):610-25.
doi: 10.1111/j.1600-0854.2012.01327.x. Epub 2012 Jan 31.

Distinct recycling of active and inactive β1 integrins

Affiliations
Free PMC article

Distinct recycling of active and inactive β1 integrins

Antti Arjonen et al. Traffic. 2012 Apr.
Free PMC article

Abstract

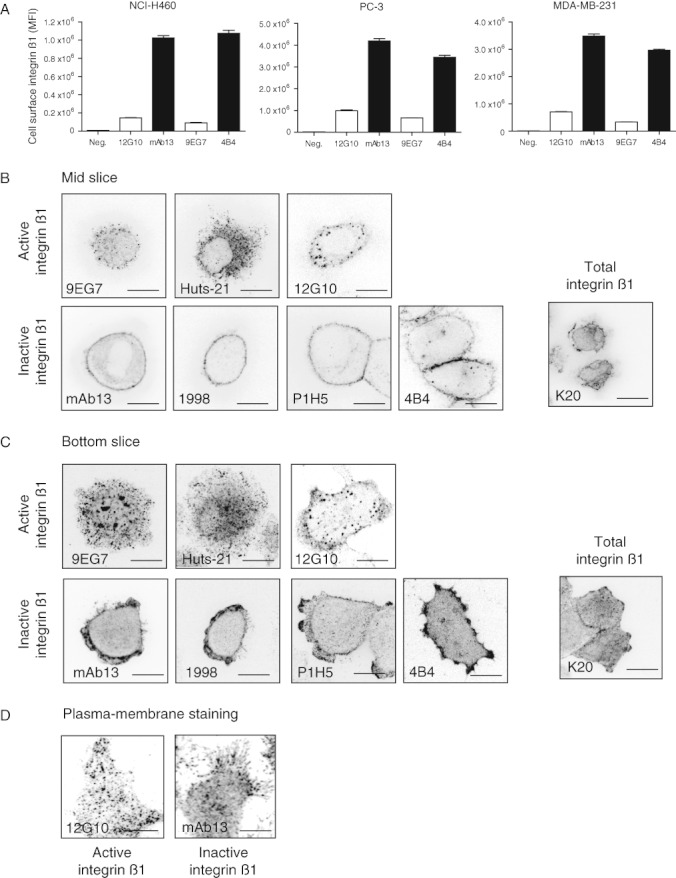
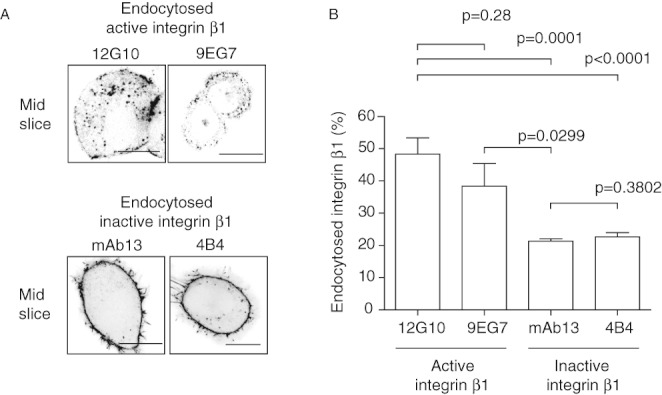
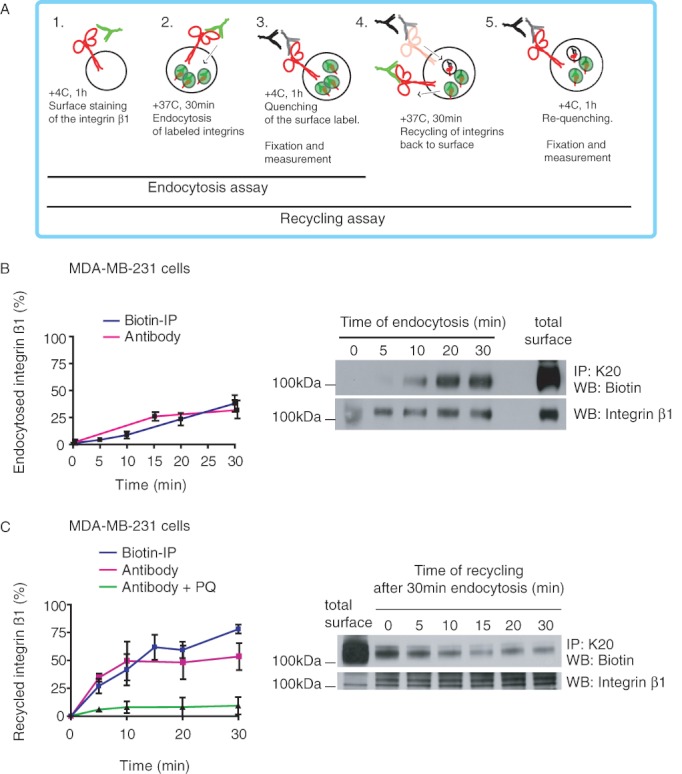
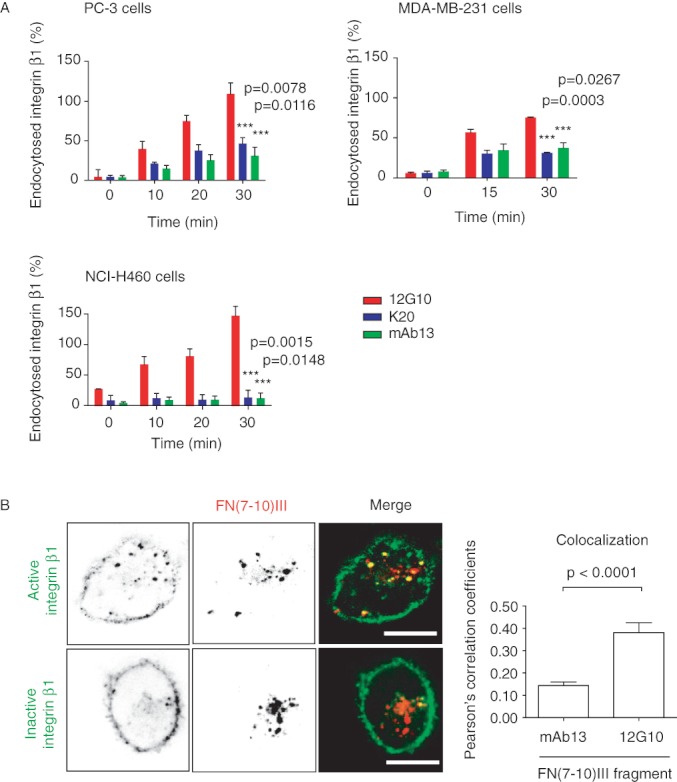
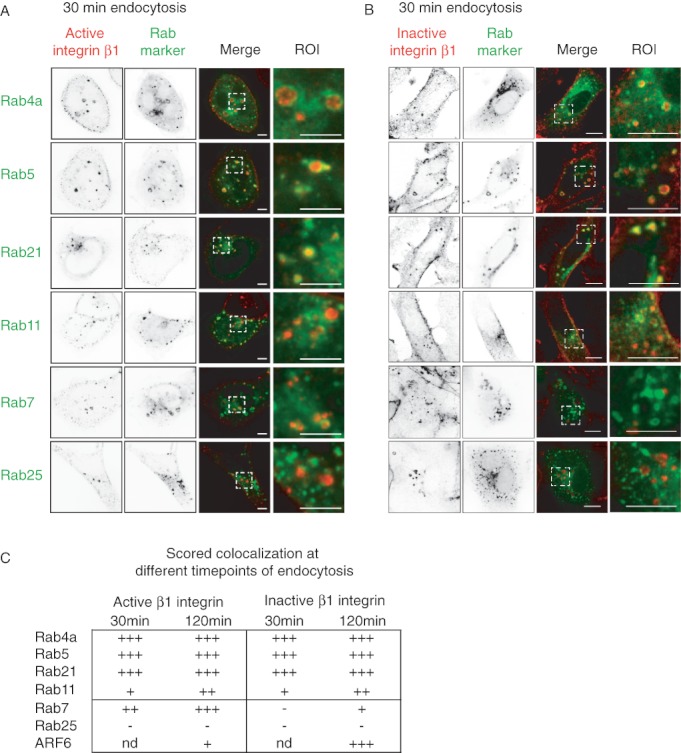
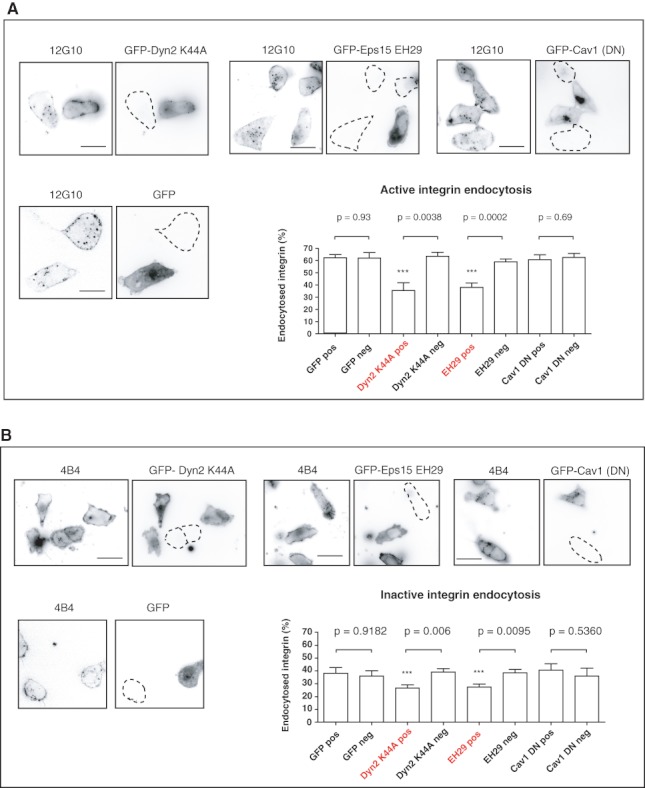
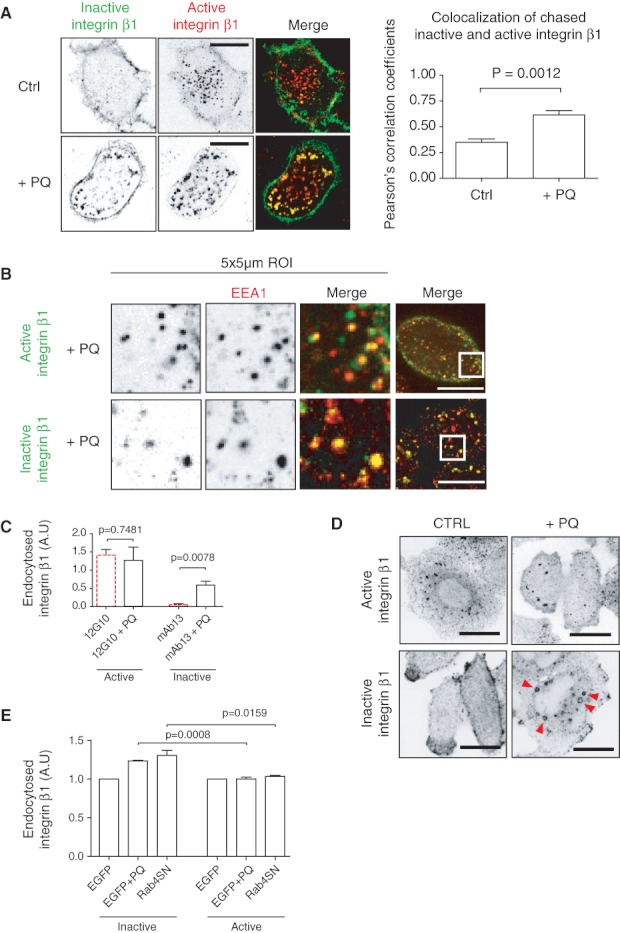
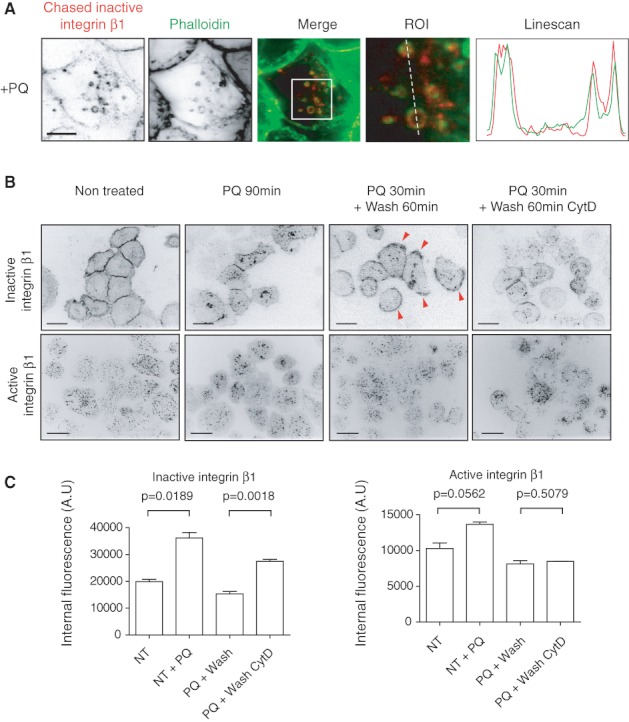
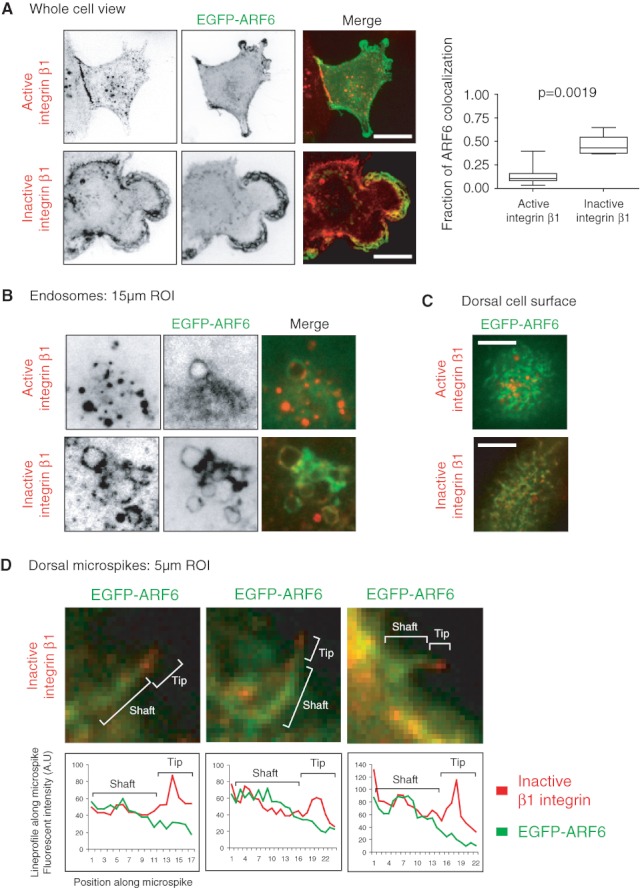
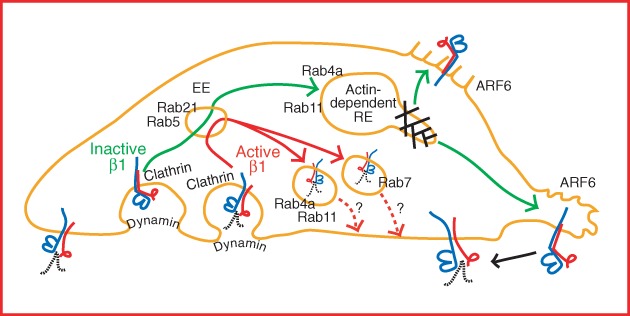
Integrin trafficking plays an important role in cellular motility and cytokinesis. Integrins undergo constant endo/exocytic shuttling to facilitate the dynamic regulation of cell adhesion. Integrin activity toward the components of the extracellular matrix is regulated by the ability of these receptors to switch between active and inactive conformations. Several cellular signalling pathways have been described in the regulation of integrin traffic under different conditions. However, the interrelationship between integrin activity conformations and their endocytic fate have remained incompletely understood. Here, we have investigated the endocytic trafficking of active and inactive β1 integrins in cancer cells. Both conformers are endocytosed in a clathrin- and dynamin-dependent manner. The net endocytosis rate of the active β1 integrins is higher, whereas endocytosis of the inactive β1 integrin is counteracted by rapid recycling back to the plasma membrane via an ARF6- and early endosome antigen 1-positive compartment in an Rab4a- and actin-dependent manner. Owing to these distinct trafficking routes, the two receptor pools display divergent subcellular localization. At steady state, the inactive β1 integrin is mainly on the plasma membrane, whereas the active receptor is predominantly intracellular. These data provide new insights into the endocytic traffic of integrins and imply the possibility of a previously unappreciated crosstalk between pathways regulating integrin activity and traffic.


Figures

Figure 1
Figure 1
Active β1 integrins are predominantly cytoplasmic, whereas inactive β1 integrins localize to the plasma membrane and protrusions. A) NCI-H 460, PC-3 and MDA-MB -231 cells were harvested with HyQ tase and cell surface β1 integrin expression was measured with flow cytometry. Indicated antibodies against active (12 G1 0 and 9 EG 7, open bars) and inactive (mAb 13 and 4 B 4, black bars) β1 integrin were used. Columns show mean fluorescent intensities ( MFI ) and mean + standard error of the mean of three independent experiments. B and C) NCI-H 460 cells were grown under regular cell culture conditions. The cells were fixed, permeabilized and stained as indicated. B) Confocal mid-sections of representative cells stained with antibodies against active β1 integrin (9 EG 7, Huts -21 and 12 G 10), inactive β1 integrin (mAb 13, 1998, P 1 H 5 and 4 B 4) and total β1 integrin ( K 20) are shown. C) Confocal bottom slice sections of representative cells stained against β1 integrins as above are shown. D) Total internal reflection fluorescence microscopy images of NCI-H 460 cells stained against active β1 integrin (12 G 10) and inactive β1 integrin ( mAb 13). Scale bar 10 µm.
Figure 2
Figure 2
The active β1 integrin is internalized more efficiently than the inactive conformation. A) NCI-H 460 cells were grown under regular cell culture conditions. Cells were lifted on ice and stained for 1 h with the indicated monoclonal anti-β1 integrin antibodies. Cells were lifted back to +37°C and allowed to endocytose the primary antibodies for 30 min. Cells were fixed, permeabilized and stained with secondary antibodies. The mid-section of a confocal stack is shown. B) The intensity of endocytosed integrin was quantified from the confocal images (n = 10–16) using a region of interest (ROI) inside the cell and normalized against the total staining of the cell. Scale bar 10 µm. Columns show mean + standard error of the mean. p V alues are calculated using M ann– W hitney test.
Figure 3
Figure 3
Antibody- and quenching-based method allows direct measurement of integrin trafficking. A) Outline of the antibody-based integrin trafficking assay for measuring endocytosis and recycling. B) Comparison of β1 integrin endocytosis in MDA-MB -231 cells with antibody-based and biotin– IP -based assays using total β1 integrin K 20 antibody. Graph shows mean ± standard error of the mean ( SEM ) of three independent experiments. Total surface and endocytosed biotin-labelled β1 integrin are shown in the western blot. C) Comparison of β1 integrin recycling in MDA-MB -231 cells with antibody-based and biotin– IP -based assays using total β1 integrin K 20 antibody. PQ was used to block the endosomal recycling of integrins (green line). Graph shows mean ± SEM of three independent experiments. Total surface, total endocytosed (30 min) and recycled biotin-labelled β1 integrins are shown in the western blot.
Figure 4
Figure 4
Active β1 integrin has a higher net endocytosis rate and co-traffics with ligand. A) PC -3, MDA-MB -231 and NCI-H 460 cells were labelled with monoclonal antibodies against active, inactive and total β1 integrin (12 G 10, mAb 13 and K 20, respectively). The antibody-based integrin endocytosis assay was used to measure integrin β1 endocytosis over time. Columns show mean + standard error of the mean ( SEM ) of three independent experiments. p V alues are calculated using M ann– W hitney test. B) MDA-MB -231 cells were surface labelled for 1 h on ice with A lexa F luor 488-labelled fibronectin fragment FN (7-10) and allowed to internalize the ligand for 15 min at 37°C. Cells were then surface labelled with A lexa F luor 647-labelled anti-β1 integrin antibodies against active and inactive conformations (12 G1 0 and mAb 13) for 1 h on ice and allowed to internalize the antibodies for 30 min at 37°C. Mid-slice confocal images are shown. Columns show mean + SEM of colocalization over the whole image as PC coefficients (n = 10). p V alues are calculated using M ann– W hitney test.
Figure 5
Figure 5
The endosomal trafficking pathway of active and inactive β1 integrins. MDA-MB -231 cells were transfected with EGFP -tagged small Rab GTPases and surface stained with antibodies against active (12 G1 0) (A) or inactive ( mAb 13) (B) β1 integrins. Integrins were allowed to endocytose for 30 min and cells were fixed, counterstained and analysed under confocal microscope. Mid-slices and ROI are shown. Scale bar 10 µm. C) Colocalization of β1 integrins and different small Rab - GTPases was scored by visual comparison. Three plus indicates good and clear colocalization in endosomes, whereas single plus only partial colocalization. Minus indicates no colocalization. Nd stands for not determined.
Figure 6
Figure 6
The endocytosis of active and inactive β1 integrins is dynamin and clathrin dependent. MDA-MB-231 cells were transfected with GFP-tagged dominant-negative dynamin-2 (K44A), dominant-negative Eps15 (EH29), dominant-negative caveolin-1 (EGFP-caveolin-1) and EGFP alone. A) Active β1 integrins (12G10) were surface labelled for 1 h on ice, and cells were allowed to endocytose the antibodies for 30 min at 37°C. B) Inactive β1 integrins (mAb13) were surface labelled for 1 h on ice, and the cells were allowed to endocytose the antibodies for 30 min at 37°C. In both (A) and (B), the amount of endocytosed integrin was quantified from confocal mid-sections and normalized to the total staining of the cell. The striated lines mark for untransfected cells. Columns show mean + standard error of the mean of GFP-positive and GFP-negative cells. p Values are calculated using Mann–Whitney test (n = 10–17). Scale bar 10 µm.
Figure 7
Figure 7
Inhibition of recycling increases the amount of endocytosed inactive β1 integrins. A) NCI-H460 cells were double labelled for 1 h on ice with β1 integrin antibodies against active (12G10) and inactive (mAb13) conformations. To block the recycling, 0.5 m m PQ was added during the 30-min endocytosis at +37°C. Cells were fixed and imaged with confocal microscope. Scale bar 10 µm. Columns show mean + standard error of the mean (SEM) of PC coefficients of the colocalization over the whole image between active and inactive β1 integrins (n = 10). p Values are calculated using Mann–Whitney test. B) NCI-H460 cells treated with 0.5 m m PQ were allowed to endocytose antibodies against active (12G10) and inactive (mAb13) β1 integrins. Cells were fixed, permeabilized and stained against early endosome marker EEA1. Scale bar 10 µm. C) Results of antibody-based endocytosis assay using fluorescent plate-reader. NCI-H460 cells were allowed to endocytose active (12G10) and inactive (mAb13) β1 integrin with and without 0.5 m m PQ for 30 min at 37°C. The graphs show mean + SEM of three independent experiments. p Values are calculated using Mann–Whitney test. D) NCI-H460 cells were treated with 0.5 m m PQ for 30 min at 37°C, fixed and stained against active (12G10) and inactive (mAb13) integrin β1. Arrowheads point to endosomes containing inactive β1 integrin. E) MDA-MB-231 cells were transfected with EGFP-alone or EGFP-Rab4a-S22N. Cells were harvested with HyQtase and surface stained against inactive (mAb13) or active (12G10) β1 integrins. Integrins were allowed to endocytose for 60 min, and the level of cell surface β1 integrin was analysed from non-treated, PQ-treated and EGFP-Rab4a-S22N positive cells before and after endocytosis. Columns show level of endocytosed β1 integrin normalized to EGFP-control, mean + SEM of three independent experiments. p Values are calculated using unpaired t-test.
Figure 8
Figure 8
Inactive β1 integrin recycling is dependent on actin. A) NCI-H 460 cells were labelled for 1 h on ice and allowed to endocytose inactive β1 integrin ( mAb 13, A lexa F luor 647-labelled) for 30 min at 37°C with 0.5 m m PQ. Cells were fixed and stained with A lexa F luor 488 P halloidin to visualize F -actin. A line scan and ROI are shown on the right. Scale bar 10 µm. B) NCI-H 460 cells were surface labelled against inactive ( mAb 13) or active (12 G1 0) β1 integrin for 1 h on ice and incubated at 37°C with growth medium (non-treated) for 90 min, with 0.5 m m PQ for 90 min, with 0.5 m m PQ for 30 min followed by a 60-min medium wash, with 0.5 m m PQ for 30 min followed by a 60-min wash with medium containing 20 m m CytD. Mid-slice confocal images are shown. Arrowheads point to membrane-relocalized inactive β1 integrin. Scale bar 10 µm. C) NCI-H 460 cells were surface labelled against inactive ( mAb 13) or active (12 G1 0) β1 integrin 60 min on ice and incubated at 37°C with growth medium (non-treated) for 60 min, with 0.5 m m PQ for 60 min, with 0.5 m m PQ for 30 min followed by a 30-min medium wash, with 0.5 m m PQ for 30 min followed by a 30 min wash with medium containing 20 m m CytD. Cells were lifted on ice and cell surface fluorescence was quenched. The level of internal β1 integrin was measured using automated fluorescent microscope ScanR. Columns show mean + standard error of the mean of 6000–8000 cells. P V alues are calculated using unpaired t-test.
Figure 9
Figure 9
Inactive β1 integrin localizes to ARF6-positive endosomes and protrusions. MDA-MB-231 cells were transfected with EGFP-ARF6. Cells were surface labelled against inactive (mAb13) or active (12G10) β1 integrin. Integrins were allowed to endocytose 120 min, cells were fixed, counterstained and analysed under confocal microscope. A) Mid-sections are shown. Scale bar 10 µm. The fraction of ARF6 colocalization with active and inactive β1 integrin was quantified. Graph shows mean ± standard error of the mean. p Value was calculated using Mann–Whitney test. B) Fifteen micrometre ROIs of ARF6-positive endosomes are shown. C) Dorsal cell surfaces are shown. Scale bar 10 µm. D) Five micrometre ROIs of dorsal cell surface are shown with linescan along the ARF6-positive microspike. Shaft and tip regions are illustrated over the ROI and the corresponding region marked over the linescan.
Figure 10
Figure 10
Model of distinct recycling routes of active and inactive β1 integrins. A model of active and inactive β1 integrin trafficking. Both conformations are endocytosed clathrin and dynamin dependently to early endosomes (EE) and to Rab5/Rab21-positive endosomes where the conformer separation probably takes place. The active β1 integrin is targeted to a Rab7 compartment, whereas the endocytosis of the inactive β1 integrin is balanced with rapid F-actin and Rab4-dependent recycling targeting integrins back to ARF6-positive protrusions on the plasma membrane. The active β1 integrin recycling is less efficient, and it is currently unclear whether ligand separation or integrin inactivation is needed as a signal for active integrin recycling and reusage. Active β1 integrin is seen in Rab4a- and Rab11-positive compartments, but more careful studies in respect to active β1 integrin recycling are needed. RE, recycling endosome.

References

    1. Fletcher SJ, Rappoport JZ. Moving forward: polarised trafficking in cell migration. Trends Cell Biol. 2010;20:71–78. - PubMed
    1. Hynes RO. Integrins: bidirectional, allosteric signaling machines. Cell. 2002;110:673–687. - PubMed
    1. Luo BH, Carman CV, Springer TA. Structural basis of integrin regulation and signaling. Annu Rev Immunol. 2007;25:619–647. - PMC - PubMed
    1. Kim M, Carman CV, Springer TA. Bidirectional transmembrane signaling by cytoplasmic domain separation in integrins. Science. 2003;301:1720–1725. - PubMed
    1. Zaidel-Bar R, Itzkovitz S, Ma'ayan A, Iyengar R, Geiger B. Functional atlas of the integrin adhesome. Nat Cell Biol. 2007;9:858–867. - PMC - PubMed

Publication types

LinkOut - more resources