. 2012 Jul;61(4):579-93.
doi: 10.1093/sysbio/syr131. Epub 2012 Jan 4.

Phylogenetic inference via sequential Monte Carlo

Affiliations

Phylogenetic inference via sequential Monte Carlo

Alexandre Bouchard-Côté et al. Syst Biol. 2012 Jul.

Abstract

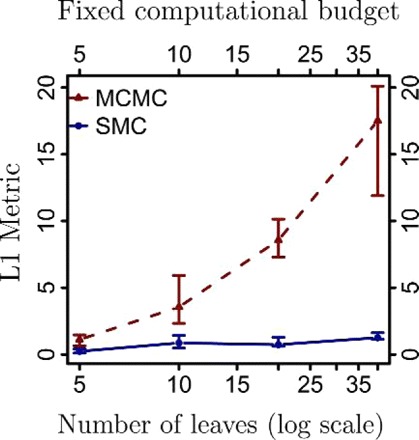
Bayesian inference provides an appealing general framework for phylogenetic analysis, able to incorporate a wide variety of modeling assumptions and to provide a coherent treatment of uncertainty. Existing computational approaches to bayesian inference based on Markov chain Monte Carlo (MCMC) have not, however, kept pace with the scale of the data analysis problems in phylogenetics, and this has hindered the adoption of bayesian methods. In this paper, we present an alternative to MCMC based on Sequential Monte Carlo (SMC). We develop an extension of classical SMC based on partially ordered sets and show how to apply this framework--which we refer to as PosetSMC--to phylogenetic analysis. We provide a theoretical treatment of PosetSMC and also present experimental evaluation of PosetSMC on both synthetic and real data. The empirical results demonstrate that PosetSMC is a very promising alternative to MCMC, providing up to two orders of magnitude faster convergence. We discuss other factors favorable to the adoption of PosetSMC in phylogenetics, including its ability to estimate marginal likelihoods, its ready implementability on parallel and distributed computing platforms, and the possibility of combining with MCMC in hybrid MCMC-SMC schemes. Software for PosetSMC is available at http://www.stat.ubc.ca/ bouchard/PosetSMC.


Figures

F<sc>IGURE</sc> 1.
FIGURE 1.
An overview of the PosetSMC algorithmic framework. A PosetSMC algorithm maintains a set of partial states (three partial states are shown in the leftmost column in the figure; each partial state is a forest over the leaves A, B, C, and D). Associated with each partial state is a positive-valued weight. The algorithm iterates the following three steps: (i) resample from the weighted partial states to obtain an unweighted set of partial states, (ii) propose an extension of each partial state to a new partial state in which two trees in the forest have been connected, and (iii) calculate the weights associated with the new partial states.
F<sc>IGURE</sc> 2.
FIGURE 2.
To illustrate how PosetSMC sequentially samples from the space of trees, we present a subset of the Hasse diagram induced by the naive proposal described in the Examples section. Note that this diagram is not a phylogenetic tree: The circles correspond to partial states (phylogenetic forests), organized in rows ordered by their rank ρ, and edges denote a positive transition density between pairs of partial states. The forests are labeled by the union of the sets of nontrivial rooted clades over the trees in the forest. The dashed lines correspond to the proposal moves forbidden by the strict height increase condition (Assumption 2(b) in the text). Note that we show only a subset of the Hasse graph since the branch lengths make the graph infinite. The subset shown here is based on an intersection of height function fibers: Given a subset of the leaves XX, we define the height function hX(s) as the height of the most recent common ancestor of X in s, if X is a clade in one of the trees in s, and ω otherwise, where ω ∉ ℝ. Given a map f:2X[0,), the subset of the vertices of the Hasse diagram shown is given by XXhX1({f(X),ω}). The graph shown here corresponds to any f such that f({A,B}) < f({C,D}), f({A,C})<f({B,D}), and f({A,D})<f({B,C}).
F<sc>IGURE</sc> 3.
FIGURE 3.
Comparison of the convergence time of PosetSMC and MCMC. We generated coalescent trees of different sizes and data sets of 1000 nucleotides. We computed the L1 distance of the minimum Bayes risk reconstruction to the true generating tree as a function of the running time (in units of the number of peeling recursions, on a log scale). The missing MCMC data points are due to MrBayes stalling on these executions.
F<sc>IGURE</sc> 4.
FIGURE 4.
L1 distances of the minimum Bayes risk reconstruction to the true generating tree (averaged over trees and executions) as a function of the tree size (number of leaves on a log scale), measured for SMC algorithms run with 1000 particles and MCMC algorithms run for 1000 iterations.
F<sc>IGURE</sc> 5.
FIGURE 5.
Analysis of the same data as in Figure 3, for 20 leaves, but with different metrics: L2 and Partition metrics, respectively.
F<sc>IGURE</sc> 6.
FIGURE 6.
Comparison of two types of SMC proposal distributions.
F<sc>IGURE</sc> 7.
FIGURE 7.
Experiments with trees generated from different models. We consider data generated by Yule processes and uniform-branch-length trees. We compare the L1 distance of the minimum Bayes reconstruction with the true generating tree for PosetSMC and MCMC.
F<sc>IGURE</sc> 8.
FIGURE 8.
Experiments on synthetic gene frequencies using a Brownian motion likelihood model. We show results for two tree sizes. In each case, we plot the partition metric as a function of the wall time in milliseconds, shown on a log scale
F<sc>IGURE</sc> 9.
FIGURE 9.
Results on ribosomal RNA data (Cannone et al. 2002) on different tree sizes, comparing the log likelihood of the minimum Bayes risk reconstruction from SMC and MCMC approximations, as a function of the running time (in units of the number of peeling recursions on a log scale).
F<sc>IGURE</sc> 10.
FIGURE 10.
Results on human gene frequency data (Li et al. 2008), comparing the log likelihood of the minimum Bayes risk reconstruction from SMC and MCMC approximations, as a function of the running time (in milliseconds, on a log scale).
F<sc>IGURE</sc> 11.
FIGURE 11.
In this figure, we give a qualitative interpretation for the difference in log likelihood in Figure 10 for the consensus tree obtained from SMC with 10,000 particles and from MCMC with 10,000 iterations. Since both runs are under sampled, the higher-order groupings are incorrect in both trees, but we can see that more mid- and low-order ethnic/geographic groupings are already captured by SMC.
F<sc>IGURE</sc> A1.
FIGURE A1.
A partial state s is extended to a new partial partial state s by merging trees tl and tr to form a tree tm with height h4>h3. In the PriorPrior proposal, tl and tr are chosen uniformly from the three possible pairs, whereas the height increment δ4 is chosen from an exponential distribution. In the PriorPost proposal, δ4 is chosen from the exponential prior and, given δ4, the pair to merge is chosen from a multinomial with parameters proportional to the likelihood of the tree tm.

Similar articles

Cited by

References

    1. Altekar G, Dwarkadas S, Huelsenbeck JP, Ronquist F. Parallel Metropolis coupled Markov chain Monte carlo for Bayesian phylogenetic inference. Bioinformatics. 2004;20:407–415. - PubMed
    1. Andrieu C, Doucet A, Holenstein R. Particle Markov chain Monte Carlo methods. J. R. Stat. Soc. Series B. Stat. Methodol. 2010;72:269–342.
    1. Beaumont MA, Zhang W, Balding DJ. Approximate Bayesian computation in population genetics. Genetics. 2002;162:2025–2035. - PMC - PubMed
    1. Bourque M. Arbres de Steiner et réseaux dont certains sommets sont à localisation variable [PhD dissertation]. Montreal (QC): Université de Montréal. 1978
    1. Cannone JJ, Subramanian S, Schnare MN, Collett JR, D'Souza LM, Du Y, Feng B, Lin N, Madabusi LV, Muller KM, Pande N, Shang Z, Yu N, Gutell RR. The comparative RNA web (CRW) site: an online database of comparative sequence and structure information for ribosomal, intron, and other RNAs. BMC Bioinformatics. 2002;3:2. - PMC - PubMed

Publication types

Substances