. 2012 Apr;60(4):541-58.
doi: 10.1002/glia.22287. Epub 2012 Jan 5.

Effects of aging and sensory loss on glial cells in mouse visual and auditory cortices

Affiliations

Effects of aging and sensory loss on glial cells in mouse visual and auditory cortices

Marie-Ève Tremblay et al. Glia. 2012 Apr.

Abstract

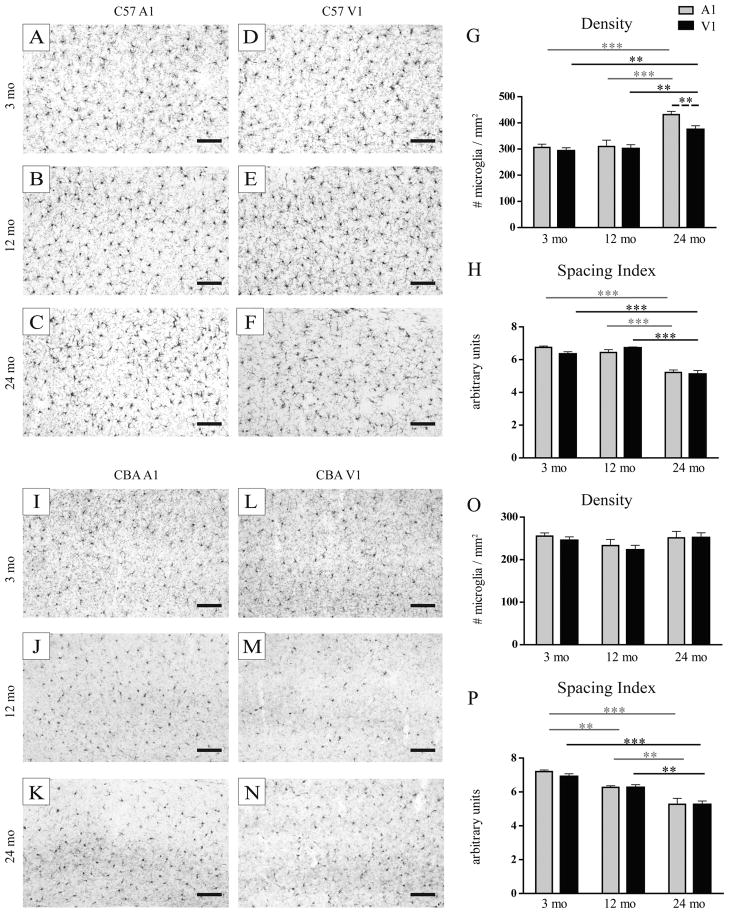
Normal aging is often accompanied by a progressive loss of receptor sensitivity in hearing and vision, whose consequences on cellular function in cortical sensory areas have remained largely unknown. By examining the primary auditory (A1) and visual (V1) cortices in two inbred strains of mice undergoing either age-related loss of audition (C57BL/6J) or vision (CBA/CaJ), we were able to describe cellular and subcellular changes that were associated with normal aging (occurring in A1 and V1 of both strains) or specifically with age-related sensory loss (only in A1 of C57BL/6J or V1 of CBA/CaJ), using immunocytochemical electron microscopy and light microscopy. While the changes were subtle in neurons, glial cells and especially microglia were transformed in aged animals. Microglia became more numerous and irregularly distributed, displayed more variable cell body and process morphologies, occupied smaller territories, and accumulated phagocytic inclusions that often displayed ultrastructural features of synaptic elements. Additionally, evidence of myelination defects were observed, and aged oligodendrocytes became more numerous and were more often encountered in contiguous pairs. Most of these effects were profoundly exacerbated by age-related sensory loss. Together, our results suggest that the age-related alteration of glial cells in sensory cortical areas can be accelerated by activity-driven central mechanisms that result from an age-related loss of peripheral sensitivity. In light of our observations, these age-related changes in sensory function should be considered when investigating cellular, cortical, and behavioral functions throughout the lifespan in these commonly used C57BL/6J and CBA/CaJ mouse models.


Figures

Figure 1
Figure 1
Changes in sensitivity to acoustic and photic stimulation with increasing age in C57 and CBA mice. A. Mean (SEM) strength in reflex inhibition (PPI) provided by a light flash summed over 70, 110 and 160 ms before the startle noise burst. The difference in photic sensitivity between the two strains was minimal in young mice, but the two groups separated as performance steadily decreased in CBA mice between 4 and 19 months of age. B. Mean strength in reflex inhibition (PPI) provided by an acoustic stimulus, a brief gap in a background noise, summed over 60, 110 and 160 ms before the startle noise burst. The greater sensitivity of the CBA mice to this acoustic stimulus was present even in the youngest mice, then the difference between the groups increased with advancing age as performance decreased between 4 and 10 months of age in C57 mice. C. Age-related changes in hearing thresholds provided by the ABR technique. The test frequencies are grouped as low frequency, (Lo F, Mean SEM of 3 and 6 kHz) and high frequency (Hi F, Mean (SEM) of 24, 32, and 48 kHz). There was no significant difference between the strains at 2 months of age, but differences emerged within the first year of life, as thresholds for the C57 mice rapidly increased, especially at Hi F. By the end of the second year the thresholds for the C57 mice were beyond the intensity limits of our instruments (> 90 dB SPL) while the thresholds for the CBA mice were minimally affected by just 10 to 15 dB.
Figure 2
Figure 2
Ultrastructural changes in neurons during normal aging and age-related sensory impairment in C57 and CBA mice. AD: EM images showing aged neurons that contain multiple lysosomal inclusions (asterisks) and/or mitochondria in their perikaryal cytoplasm (m; B). In C and D, the neurons display condensed, electron-dense cytoplasm and nucleoplasm, more frequent ruffling of the plasma membrane, extensive invagination of the nuclear membrane (arrow; C), and dilation of the endoplasmic reticulum (arrowheads; D), possibly suggesting an ongoing degenerative process. D, dark neuron; M, microglia; N, neuron; O, oligodendrocyte. Scale bars=1 μm. EG: Number of lysosomal inclusions per neuron (E), number of dark neurons per 10,000 μm2 of ultrathin section (F), and number of lysosomal inclusions per dark neuron (G; mean ± SEM). Grey lines and asterisks refer to statistical comparisons between A1 regions, black lines and asterisks to comparisons between V1 regions, and black dotted line and asterisk to comparison between A1 and V1 regions. *, p<0.05 and **, p<0.01.
Figure 3
Figure 3
Changes in density and distribution of microglia in C57 and CBA mice. A–L: low magnification photomicrographs showing an increase in density and clumping in C57 A1 A–F, I–N: low magnification photomicrographs showing an increase in density and clumping in A1 (AC) and V1 (D–F) of the C57 in contrast to an increase in clumping without change in density in A1 (I–K) and V1 (L–N) of the CBA. Scale bars=100 μm. Quantification of microglial density in C57 (G) and CBA (O), and spacing index in C57 (H) and CBA (P) mice. Statistics refer to post hoc analyses based on a 2-way ANOVA. **, p<0.01, ***, p<0.001. Statistical comparisons are illustrated as in Figure 2.
Figure 4
Figure 4
Changes in the morphology of microglia in the C57 mouse. A–F: high magnification photomicrographs illustrating the decline in size and complexity of processes arborization without obvious changes in soma size in 24 mo C57 mice: A1 (A–C) and V1 (D–F). Scale bars=25 μm. Arrowheads show examples of clumped microglia. Quantification of the area of the process arbor (G), arbor circularity index (H), morphological index (I), average soma area (J), soma area standard deviation (SD; K), and morphological index standard deviation (L). Statistics refer to post hoc analyses based on a 2-way ANOVA. *, p< 0.05, **, p<0.01, ***, p<0.001. Statistical comparisons are illustrated as in Figure 2.
Figure 5
Figure 5
Changes in the morphology of microglia in the CBA mouse. A–F: high magnification photomicrographs illustrating the decline in size and complexity of processes arborization without obvious changes in soma size by 12 mo in CBA mice: A1 (A–C) and V1 (D–F). Scale bars=25 μm. Quantification of the area of the process arbor (G), arbor circularity index (H), morphological index (I), average soma area (J), soma area standard deviation (SD; K), and morphological index standard deviation (L). Statistics refer to post hoc analyses based on a 2-way ANOVA. **, p<0.01, ***, p<0.001. Statistical comparisons are illustrated as in Figure 2.
Figure 6
Figure 6
Ultrastructural changes in microglia in C57 and CBA mice. AD: Aged microglia accumulating various types of non-cellular inclusions, including lysosomal inclusions (asterisks), vacuoles and large vesicles (arrow; A), and lipid droplets of various sizes (arrow; D), which could result from the phagocytic elimination of neurons or glial cells. The microglia in C appears almost completely filled by cellular debris, akin to fat granule cells or gitter cells. Also note the size diversity of microglial cell bodies (see A and D for example of normal size, B and C for example of enlarged size). Immunoperoxidase staining for the microglia-specific marker IBA1 is shown by arrowheads. M, microglia. Scale bars=1 μm. E: Number of inclusions per microglia (lysosomal inclusions, vacuoles, small to large vesicles, lipid droplets, and cellular elements such as dendritic spines and axon terminals (see Figure 7); mean ± SEM). Statistical comparisons are illustrated as in Figure 2. *, p<0.05 and ***, p<0.001.
Figure 7
Figure 7
Changes in microglial engulfment of synaptic elements in C57 and CBA mice. AF: Young and aged microglia displaying cellular inclusions (in) in their cell body (C, inset in D), proximal process (A, inset in B), or distal processes (E and F). Cellular inclusions sometimes resembled profiles of axon terminals (“t”; see B and DF for examples) and dendritic spines (“s”; E for example) with contained pockets of electron-lucent space (arrows; D and E), suggesting the phagocytic engulfment of synaptic elements by microglia. In F, the microglia extends a fine process (arrows) between an axon terminal that appears completely ensheathed (“t”) and a dendrite (d), in a way reminiscent of synaptic stripping. In all pictures, microglial profiles show an electron-dense immunoperoxidase staining for IBA1. M, microglia; s, dendritic spine; t, axon terminal; v, vacuole. Scale bars=1 μm for AD, 0.5 μm for E, and 0.25 μm for F.
Figure 8
Figure 8
Ultrastructural changes in astrocytes, oligodendrocytes, and axonal myelination in C57 and CBA mice. A and B: EM examples of aged astrocytes (A) with enlarged processes typically surrounding a blood vessel (BV; A) or containing large accumulations of lysosomal inclusions (B). C and D: Aged oligodendrocytes (O) devoid of lysosomal inclusions, encountered in a pair (C) or containing electron-lucent pockets in their perikaryal cytoplasm (arrowheads). E and F: Myelinated axons (MA) with redundant (arrows; E and F) or ballooned (see the large electron-lucent space in the sheath of the lower right MA; F) myelin sheaths. m, mitochondria. Scale bars=1 μm. G. Number of oligodendrocytes per 10,000 μm2 of ultrathin section (mean ± SEM). Statistical comparisons are illustrated as in Figure 2. **, p<0.01.

References

    1. Al-Abdulla NA, Martin LJ. Apoptosis of retrogradely degenerating neurons occurs in association with the accumulation of perikaryal mitochondria and oxidative damage to the nucleus. Am J Pathol. 1998;153:447–56. - PMC - PubMed
    1. Anderson JM, Hubbard BM, Coghill GR, Slidders W. The effect of advanced old age on the neurone content of the cerebral cortex. Observations with an automatic image analyser point counting method. J Neurol Sci. 1983;58:235–46. - PubMed
    1. Auer RN, Kalimo H, Olsson Y, Siesjo BK. The temporal evolution of hypoglycemic brain damage. I. Light- and electron-microscopic findings in the rat cerebral cortex. Acta Neuropathol. 1985;67:13–24. - PubMed
    1. Bach ME, Barad M, Son H, Zhuo M, Lu YF, Shih R, Mansuy I, Hawkins RD, Kandel ER. Age-related defects in spatial memory are correlated with defects in the late phase of hippocampal long-term potentiation in vitro and are attenuated by drugs that enhance the cAMP signaling pathway. Proc Natl Acad Sci U S A. 1999;96:5280–5. - PMC - PubMed
    1. Barnes CA, McNaughton BL. Physiological compensation for loss of afferent synapses in rat hippocampal granule cells during senescence. J Physiol. 1980;309:473–85. - PMC - PubMed

Publication types

MeSH terms