. 2012 Jan 24;109(4):1193-8.
doi: 10.1073/pnas.1119675109. Epub 2012 Jan 5.

The mystery of missing heritability: Genetic interactions create phantom heritability

Affiliations

The mystery of missing heritability: Genetic interactions create phantom heritability

Or Zuk et al. Proc Natl Acad Sci U S A. .

Abstract

Human genetics has been haunted by the mystery of "missing heritability" of common traits. Although studies have discovered >1,200 variants associated with common diseases and traits, these variants typically appear to explain only a minority of the heritability. The proportion of heritability explained by a set of variants is the ratio of (i) the heritability due to these variants (numerator), estimated directly from their observed effects, to (ii) the total heritability (denominator), inferred indirectly from population data. The prevailing view has been that the explanation for missing heritability lies in the numerator--that is, in as-yet undiscovered variants. While many variants surely remain to be found, we show here that a substantial portion of missing heritability could arise from overestimation of the denominator, creating "phantom heritability." Specifically, (i) estimates of total heritability implicitly assume the trait involves no genetic interactions (epistasis) among loci; (ii) this assumption is not justified, because models with interactions are also consistent with observable data; and (iii) under such models, the total heritability may be much smaller and thus the proportion of heritability explained much larger. For example, 80% of the currently missing heritability for Crohn's disease could be due to genetic interactions, if the disease involves interaction among three pathways. In short, missing heritability need not directly correspond to missing variants, because current estimates of total heritability may be significantly inflated by genetic interactions. Finally, we describe a method for estimating heritability from isolated populations that is not inflated by genetic interactions.


Conflict of interest statement

The authors declare no conflict of interest.

Figures
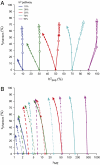
Fig. 1.
Fig. 1.
Phantom heritability under the limiting pathway model. (A) Quantitative trait model LP(k, h2pathway, cR). For various parameters, curves show apparent heritability h2pop(ACE) and phantom heritability πphantom. Curves connect points with various values of k (1, 2, 3, 4, 5, 6, 7, 10, with tip of arrow at k = 10), and for specific values of h2pathway (10, 30, 50, 70, and 90%, indicated by color of the curve) and cR (0% filled circles and arrows, 50% open boxes and arrows). The red asterisk indicates example P* referred to in the text. (The quantity h2pop can exceed 100%, as seen for some models with high heritability and for some real traits. In such cases, we set h2pop = 100%.) Raw data are in SI Appendix, Table 6. (B) Disease model LPΔ(k, h2pathway, 0%, μ). For various parameters, curves show value of λMZ and phantom heritability πphantom. Values of k and h2pathway are as in A. Values of prevalence μ are 0.1% (solid), 1% (dotted), and 10% (dashed). The red asterisk indicates example Δ* referred to in the text. In both A and B, as k increases, the trait becomes more nonlinear; phantom heritability increases to 50% and beyond. Raw data are in SI Appendix, Table 7.
Fig. 2.
Fig. 2.
Estimating additive heritability from the slope of phenotypic correlation around mean IBD sharing. We performed simulations of the estimator in theorem 1. Genotype and phenotype data were generated for samples of 1,000 individuals chosen from an isolated population (mean IBD sharing κ0 = 3.5%, SD 5.7%) and the limiting pathway trait P* (described in text) with 1,000 causal loci (see SI Appendix, section 9 for details); results were averaged over 100 simulations. For each pair of individuals, we computed the product Z1Z2 and the IBD sharing (SI Appendix). Blue error bars show mean and SD of expectation of Z1Z2 for pairs in each 1% bin of IBD sharing, estimated from all such pairs across all 100 simulations. The black curve shows an analytic approximation for the mean phenotypic similarity rR (SI Appendix, section 3.3, Eq. 3.12). The red line shows a least-squares linear regression line fitted using all pairs with IBD sharing in the interval [0, 2κ0]. The average estimated slope (multiplied by 1 − κ0) was 0.258 ± 0.082; as expected from theorem 1, this is very close to the true heritability h2all = 0.254 (and different from the apparent heritability, h2pop = 0.54).

References

    1. Lander ES. Initial impact of the sequencing of the human genome. Nature. 2011;470(7333):187–197. - PubMed
    1. Manolio TA, Brooks LD, Collins FS. A HapMap harvest of insights into the genetics of common disease. J Clin Invest. 2008;118:1590–1605. - PMC - PubMed
    1. Hirschhorn JN. Genomewide association studies—Illuminating biologic pathways. N Engl J Med. 2009;360:1699–1701. - PubMed
    1. Eichler EE, et al. Missing heritability and strategies for finding the underlying causes of complex disease. Nat Rev Genet. 2010;11:446–450. - PMC - PubMed
    1. Manolio TA, et al. Finding the missing heritability of complex diseases. Nature. 2009;461:747–753. - PMC - PubMed

Publication types

MeSH terms