. 2012;4(3):230-9.
doi: 10.1093/gbe/evs002. Epub 2012 Jan 4.

Origins and evolution of microRNA genes in plant species

Affiliations

Origins and evolution of microRNA genes in plant species

Masafumi Nozawa et al. Genome Biol Evol. 2012.

Abstract

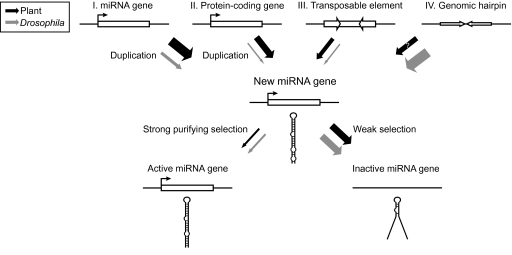
MicroRNAs (miRNAs) are among the most important regulatory elements of gene expression in animals and plants. However, their origin and evolutionary dynamics have not been studied systematically. In this paper, we identified putative miRNA genes in 11 plant species using the bioinformatic technique and examined their evolutionary changes. Our homology search indicated that no miRNA gene is currently shared between green algae and land plants. The number of miRNA genes has increased substantially in the land plant lineage, but after the divergence of eudicots and monocots, the number has changed in a lineage-specific manner. We found that miRNA genes have originated mainly by duplication of preexisting miRNA genes or protein-coding genes. Transposable elements also seem to have contributed to the generation of species-specific miRNA genes. The relative importance of these mechanisms in plants is quite different from that in Drosophila species, where the formation of hairpin structures in the genomes seems to be a major source of miRNA genes. This difference in the origin of miRNA genes between plants and Drosophila may be explained by the difference in the binding to target mRNAs between plants and animals. We also found that young miRNA genes are less conserved than old genes in plants as well as in Drosophila species. Yet, nearly half of the gene families in the ancestor of flowering plants have been lost in at least one species examined. This indicates that the repertoires of miRNA genes have changed more dynamically than previously thought during plant evolution.


Figures

F<sc>IG</sc>. 1.—
FIG. 1.—
Numbers of (A) miRNA genes and (B) gene families in the 11 plant species. White and black bars represent the numbers of non-TE-like and TE-like (in parentheses) miRNA genes (or gene families), respectively.
F<sc>IG</sc>. 2.—
FIG. 2.—
Chromosomal locations of miRNA genes and their homologous relationships in Arabidopsis and rice. Short black rods on the chromosomes represent the miRNA genes that have at least one homolog in another species, whereas long red rods indicate the miRNA genes that have no homolog in another species. Blue lines illustrate homologous relationships of miRNA genes between Arabidopsis and rice. All miRNA genes belonging to the same gene families are connected.
F<sc>IG</sc>. 3.—
FIG. 3.—
Estimates of the numbers of (A) miRNA genes and (B) gene families in ancestral species and gains and losses of miRNA genes (or gene families) during plant evolution. Numbers in squares represent the numbers of miRNA genes (or gene families) in ancestral or extant species. Numbers along each branch indicate the numbers of gains (+) and losses (−) of miRNA genes (or gene families), respectively. Numbers (+) in parentheses represent the numbers of gains of miRNA gene families that have potentially been derived from protein-coding genes. The time scale shown below the tree is from Hedges and Kumar (2009).
F<sc>IG</sc>. 4.—
FIG. 4.—
Average numbers of miRNA genes per gene family in ancestral or extant species (in squares) and proportions of gene gains by miRNA gene duplication (along each branch in italics). “n.a.” means that no gene existed in the ancestor or no gene gain occurred in the lineages. Roman numerals above branches correspond to those in figure 5.
F<sc>IG</sc>. 5.—
FIG. 5.—
Substitution rates of miRNA and protein-coding genes that originated in each branch (I–IV in fig. 4). We analyzed 24 miRNA gene families and 7,147 orthologous protein-coding genes, respectively. Error bars indicate the standard errors. The numbers of miRNA gene families analyzed for each branch are as follows: 7 for branch I, 13 for branch II, and 4 for branches III and IV.
F<sc>IG</sc>. 6.—
FIG. 6.—
Proportions of conserved sites in (A) mature and (B) star regions. Conserved sites refer to the sites where all sequences have the same nucleotides in the sequence alignments of an miRNA gene family. Each of mature and star regions was equally split into three portions, that is, upper (5′), middle, and lower (3′) portions. Error bars indicate the standard errors. The difference between the portions was tested by Monte Carlo simulation with 10,000 replications: *5% significance level; **1% significance level; n.s., not significant.
F<sc>IG</sc>. 7.—
FIG. 7.—
Possible evolutionary scenario of miRNA genes in plants (black arrows) in comparison with that in Drosophila species (gray arrows). Thickness of arrows roughly indicates the frequencies of the processes.

References

    1. Allen E, et al. Evolution of microRNA genes by inverted duplication of target gene sequences in Arabidopsis thaliana. Nat Genet. 2004;36:1282–1290. - PubMed
    1. Archak S, Nagaraju J. Computational prediction of rice (Oryza sativa) miRNA targets. Genomics Proteomics Bioinformatics. 2007;5:196–206. - PMC - PubMed
    1. Axtell MJ. Evolution of microRNAs and their targets: are all microRNAs biologically relevant? Biochim Biophys Acta. 2008;1779:725–734. - PubMed
    1. Axtell MJ, Bartel DP. Antiquity of microRNAs and their targets in land plants. Plant Cell. 2005;17:1658–1673. - PMC - PubMed
    1. Axtell MJ, Bowman JL. Evolution of plant microRNAs and their targets. Trends Plant Sci. 2008;13:343–349. - PubMed

Publication types