Comparative Study
. 2012 Mar;23(3):447-57.
doi: 10.1681/ASN.2011070666. Epub 2012 Jan 5.

Multiple factors influence glomerular albumin permeability in rats

Affiliations
Comparative Study

Multiple factors influence glomerular albumin permeability in rats

Ruben M Sandoval et al. J Am Soc Nephrol. 2012 Mar.

Abstract

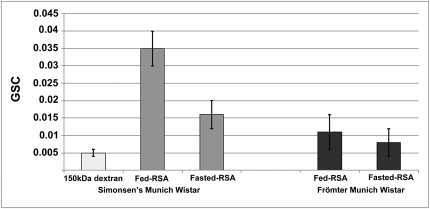
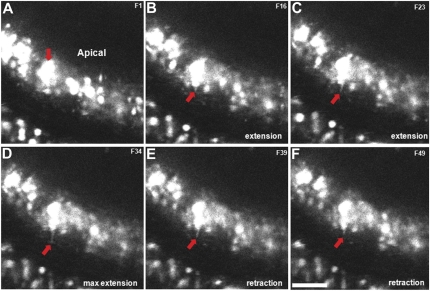
Different laboratories recently reported incongruous results describing the quantification of albumin filtration using two-photon microscopy. We investigated the factors that influence the glomerular sieving coefficient for albumin (GSC(A)) in an effort to explain these discordant reports and to develop standard operating procedures for determining GSC(A). Multiple factors influenced GSC(A), including the kidney depth of image acquisition (10-20 μm was appropriate), the selection of fluorophore (probes emitting longer wavelengths were superior), the selection of plasma regions for fluorescence measurements, the size and molecular dispersion characteristics of dextran polymers if used, dietary status, and the genetic strain of rat. Fasting reduced the GSC(A) in Simonsen Munich Wistar rats from 0.035±0.005 to 0.016±0.004 (P<0.01). Frömter Munich Wistar rats had a much lower GSC(A) in both the fed and the fasted states. Finally, we documented extensive albumin transcytosis with vesicular and tubular delivery to and fusion with the basolateral membrane in S1 proximal tubule cells. In summary, these results help explain the previously conflicting microscopy and micropuncture data describing albumin filtration and highlight the dynamic nature of glomerular albumin permeability.


Figures

Figure 1.
Figure 1.
SMW rats filter higher levels of albumin than FMW rats. In SMW rats, dietary fasting reduced GSCA values from 0.035±0.005 to 0.016±0.004 (n=9 glomeruli; three rats each; P<0.01). In their normal fed state, the FMW strain at 8 weeks of age had a GSCA value three times lower (0.010±0.001) and a fasting GSCA of 0.008±0.004 (n=24 glomeruli; 4 rats for fed; n=14 glomeruli; 3 rats for fasting; P<0.05). To investigate whether the higher GSC values for albumin obtained in this and previous studies using the SMW strain were not a result of out-of-focus fluorescence within Bowman’s space, a 150-kD fluorescein dextran was examined and found to generate a GSC value of 0.005±0.001.
Figure 2.
Figure 2.
Emitted light from shorter-wavelength fluorophores is more susceptible to scatter at deeper tissue depths. Plasma intensities from a fluorescein 69.7-kD dextran (with a peak emission of 525 nm) and Alexa 568-RSA (with a peak emission of 603 nm) within a three-dimensional glomerular volume were quantified. (A) A mixture of the two probes (green and red) appeared yellow within superficial capillary loops (approximately 12 µm into the glomerular volume) indicating a nearly equal emission for both probes. (B) At a depth of approximately 28 μm within the same glomerulus, a color shift from yellow to orange-red occurred as the contribution of green fluorescence emission within the focal plane was reduced compared with the longer-emitting red probe. (C) An orthogonal X-Z projection taken at a reference point in (A) (arrow) shows a more gradual reduction in green fluorescence through the image. (D) Intensity values confirm the more rapid plasma intensity decay of the green fluorescein 69-kD dextran. Normalized intensity values of 96%±2% for both probes were seen at depths of 16 μm. However, at 40 μm the normalized values were 66.3%±3.1% for the Alexa 568-RSA probe and 49.8%±10.6% for fluorescein (P<0.01) (n=3 glomeruli; 4 capillary loop segments/focal plane). (Bar=25 μm.)
Figure 3.
Figure 3.
Internal descanned detectors have reduced photo-sensitivity at all tissue depths when compared with external nondescanned detectors. (A) Images from a perfused fixed rat kidney sectioned and stained with a fluorescein lectin. Identical three-dimensional data sets of the same glomerulus were sequentially acquired, first using internal descanned multialkaline detectors, then by external nondescanned multialkaline detectors, and finally by a highly sensitive external nondescanned GaAsP detector. In the upper three panels, at a focal depth of approximately 5 μm, image quality is similar among the three detectors. Note that the structure in the upper right (arrow) has nearly saturated intensity values, indicating the full use of dynamic range among the three detector types. Approximately 10 μm farther into the tissue section, a noticeable decrease in image quality and a marked decrease in sensitivity to corresponding dimmer structures (highlighted region) were seen between the internal descanned and the two external nondescanned detectors in the three center panels. (B) The average intensity for each focal plane obtained using the different detectors graphed as a function of depth. At nearly all depths the internal descanned detector has reduced sensitivity. At depths greater than 10 μm, this reduction in sensitivity of the internal descanned detectors is more evident, as seen by the shape of the curve. Here, a plateau occurred at more superficial depths, with the internal detector indicative of an inability to acquire and discriminate low intensity values. (Bar=15 μm.)
Figure 4.
Figure 4.
Red blood cells do not affect the ability to accurately detect plasma fluorescence levels. (A) Image of a glomerulus infused with a 150-kD rhodamine dextran; the line corresponds to the line scan location through the capillary loops and Bowman’s space. The line scan images are shown in (C and F). The histogram shown in (D) was generated by selecting regions from frames of a movie (B) and line scan (C) and graphing the relative occurrence of all the intensity values within the selected regions. Note that this results in nearly identical overlap between both methods. Selecting the plasma fluorescence by thresholding either regions of the capillary loop (E) or the line scan (F) also gave nearly identical intensities. (G) shows the average intensity values of the image (from E) and the line scan (from F) to be 3250 and 3251, respectively. (H and I) Glomeruli from SMW rats given a constant infusion of a freely filtered FITC inulin. Note that the plasma intensities within the capillary loops (arrows) appear identical to those seen in Bowman’s space (asterisks) shown in both black and white and pseudocolor. Calculation of the GSC value for FITC inulin confirmed the similar appearance with a GSC of 1.050±0.028. Underestimation of the plasma fluorescence, as predicted previously,, would have resulted in GSC values for inulin ranging up to 17.5 (if our values of 0.035 were indeed 0.002; a 17.5-fold difference). (Bar=20 μm; pseudocolor scale denotes matching grayscale values.)
Figure 5.
Figure 5.
Fluorescent dextrans containing polymers with broadly dispersed sizes generate time-dependent GSC values. (A) SMW rats were infused with the 69.7-kD fluorescein dextran, the 70-kD rhodamine B dextran, or TR-RSA, and GSC values were calculated over time. The 70-kD rhodamine B dextran produced the greatest variance in GSC over time, with values ranging from 0.11 approximately 30 seconds after infusion to 0.015 after 45 minutes (n=2 rats; one glomeruli each/time point). The 69.7-kD fluorescein dextran initially gave a GSC value of 0.048±0.008 before settling at a value of 0.019±0.002 at 24 minutes after infusion (n=3 rats; one glomeruli each/time point). The TR-RSA gave the most consistent values throughout the time course, generating a value of 0.027±0.009 at 30 seconds after infusion and a final value of 0.028±0.002 at 24 minutes after infusion (n=3 rats; one glomeruli each/time point). (B) A micrograph of the 70-kD rhodamine B dextran with lower-molecular-weight components that have been filtered, not reabsorbed, and subsequently accumulated in a distal tubule (arrow). (C) A graph of the dispersion characteristics for a 150-kD FITC dextran, a 69.7-kD FITC dextran, and a 70-kD rhodamine B dextran using gel filtration. The 150-kD and 69.7-kD dextrans (shown in green and black tracings) had narrower elution profiles from the gel filtration column (present in fewer fractions), indicating that these compounds contained polymers more uniform in size. The 70-kD rhodamine B dextran had a much wider elution profile, indicating a sample that has a large size dispersion and contains polymers much smaller than the 70 kD eluting in higher numbered fractions to polymers larger than those found in the 150-kD fluorescein dextran sample. (D) A tracing shows the dispersion characteristics of the 69.7-kD fluorescein dextran (in green), TR-RSA (in red), and native RSA (in black). The conjugation of RSA to four TR fluorophores imparts no alteration in the size characteristic of TR-RSA because this compound and the native form have elution profiles that are narrow and virtually identical. (Bar=20 μm.)
Figure 6.
Figure 6.
Transcytosis of labeled RSA occurs via tubular and vesicular structures emanating from sequestered intracellular compartments. A two-photon intravital time series taken in a SMW rat given 2 mg of Alexa 568-RSA intravenously 24 hours before imaging shows formation, extension, and retraction of a tubular structure over 50 seconds (A–F). (A) A single frame with a large accumulation of albumin (arrow; note the orientation of the apical membrane; frame 1). (B–D) The formation of a tubular structure extending from an intracellular compartment toward the basal pole of the PTC (frames 16, 23, and 34, respectively). (D) Contact is made with the basal membrane, and a lateral perpendicular spreading of fluorescence is seen along the surface of the cell (arrow; frame 34). (E and F) The tubule is retracted toward the parent structure (frames 39 and 49, respectively). In Supplemental Movie 1, more vesicles and tubular structures can be seen mediating movement of labeled albumin from intracellular pools across the basolateral membrane. (Bar=10 µm in F.)
Figure 7.
Figure 7.
Transcytosis of RSA along the basal membrane occurs ubiquitously in the S1 proximal tubule cells of MW rats. An intravital cross-section of an S1 segment from a FMW rat shows accumulation and transcytosis of labeled albumin approximately 50 minutes after a bolus injection. The approximately 160-µm length spanning along the regions denoted (R1–R8) contained 150 detectable transcytotic events occurring at the basal membrane over a 3-minute, 40-second period. Assuming an average length of 14 µm per PTC in the X/Y orientation, this translates to approximately 54 transcytotic events (through tubular extension and vesicular trafficking) occurring at the basal membrane per cell/per minute. This value is probably an underestimation because the acquisition settings used to prevent saturation and blinding of the GaAsP detectors are incapable of detecting transcytotic structures whose fluorescent intensity falls below the minimum detection level. R1–R9 show the structure at either maximum extension in the case of tubular processes (R1, R2, R3, R4, R6, and R8) or vesicle at its closest proximity to the basal membrane (R5, R7, and R9). In Supplemental Movie 1, note the prolonged persistence of tubular extensions (such as R2), which are present for >90 seconds of this time-compressed 3-minute, 40-second movie. This is in stark contrast to the speed at which vesicles move (right of R5), approximately 1.1 µm/s. (Bar=10 µm.)

Comment in

Similar articles

Cited by

References

    1. Haraldsson B, Nyström J, Deen WM: Properties of the glomerular barrier and mechanisms of proteinuria. Physiol Rev 88: 451–487, 2008 - PubMed
    1. Remuzzi A, Sangalli F, Fassi A, Remuzzi G: Albumin concentration in the Bowman’s capsule: Multiphoton microscopy vs micropuncture technique. Kidney Int 72: 1410–1411, author reply 1411, 2007 - PubMed
    1. Wang Y, Cai H, Cebotaru L, Hryciw DH, Weinman EJ, Donowitz M, Guggino SE, Guggino WB: ClC-5: Role in endocytosis in the proximal tubule. Am J Physiol Renal Physiol 289: F850–F862, 2005 - PubMed
    1. Amsellem S, Gburek J, Hamard G, Nielsen R, Willnow TE, Devuyst O, Nexo E, Verroust PJ, Christensen EI, Kozyraki R: Cubilin is essential for albumin reabsorption in the renal proximal tubule. J Am Soc Nephrol 21: 1859–1867, 2010 - PMC - PubMed
    1. Rangel-Filho A, Sharma M, Datta YH, Moreno C, Roman RJ, Iwamoto Y, Provoost AP, Lazar J, Jacob HJ: RF-2 gene modulates proteinuria and albuminuria independently of changes in glomerular permeability in the fawn-hooded hypertensive rat. J Am Soc Nephrol 16: 852–856, 2005 - PubMed

Publication types