

Health inequalities: trends, progress, and policy
- PMID: 22224876
- PMCID: PMC3745020
- DOI: 10.1146/annurev-publhealth-031811-124658
Health inequalities: trends, progress, and policy
Abstract
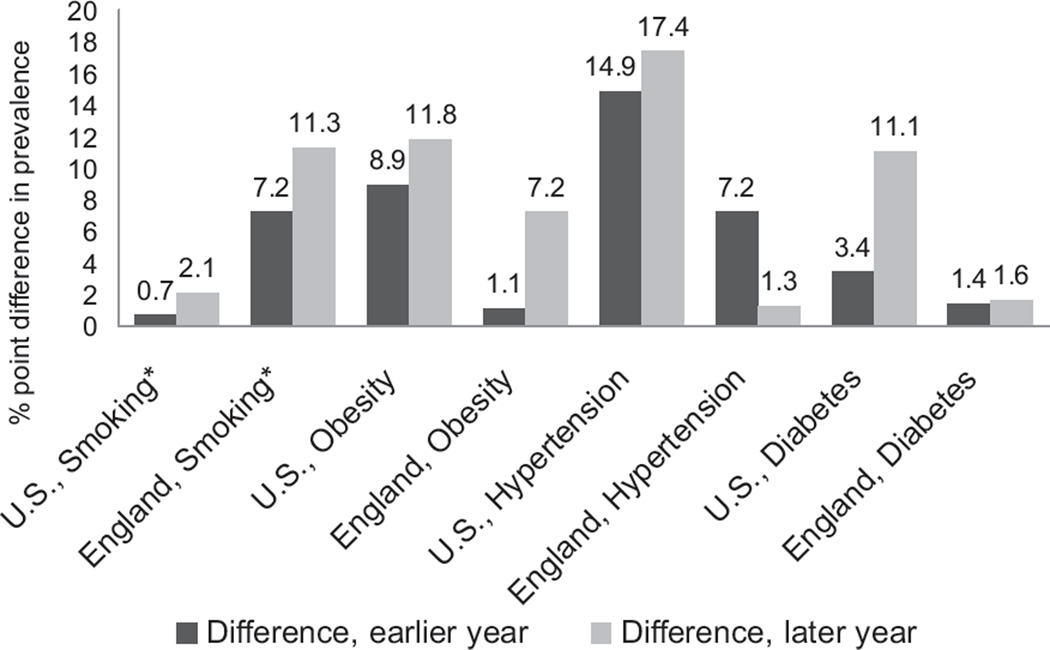
Health inequalities, which have been well documented for decades, have more recently become policy targets in developed countries. This review describes time trends in health inequalities (by sex, race/ethnicity, and socioeconomic status), commitments to reduce health inequalities, and progress made to eliminate health inequalities in the United States, United Kingdom, and other OECD countries. Time-trend data in the United States indicate a narrowing of the gap between the best- and worst-off groups in some health indicators, such as life expectancy, but a widening of the gap in others, such as diabetes prevalence. Similarly, time-trend data in the United Kingdom indicate a narrowing of the gap between the best- and worst-off groups in some indicators, such as hypertension prevalence, whereas the gap between social classes has increased for life expectancy. More research and better methods are needed to measure precisely the relationships between stated policy goals and observed trends in health inequalities.
Figures


References
-
- Acheson D. Independent Inquiry into Inequalities in Health Report. London: Station. Off; 1998.
-
- Adler NE, Rehkopf DH. US disparities in health: descriptions, causes, and mechanisms. Annu. Rev. Public Health. 2008;29:235–252. - PubMed
-
- Agency Healthcare Res. Qual. (AHRQ) National Healthcare Disparities Report. Rockville, MD: AHRQ; 2009.
-
- Assoc. Public Health Obs. Health Profiles. London: Dept. Health; 2011. http://www.apho.org.uk/default.aspx?RID=49802.
Publication types
MeSH terms
Grants and funding
LinkOut - more resources
Full Text Sources
Medical
Miscellaneous
