Altered synaptic marker abundance in the hippocampal stratum oriens of Ts65Dn mice is associated with exuberant expression of versican
- PMID: 22225533
- PMCID: PMC3275338
- DOI: 10.1042/AN20110037
Altered synaptic marker abundance in the hippocampal stratum oriens of Ts65Dn mice is associated with exuberant expression of versican
Abstract
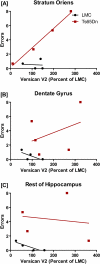
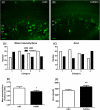
DS (Down syndrome), resulting from trisomy of chromosome 21, is the most common cause of genetic mental retardation; however, the molecular mechanisms underlying the cognitive deficits are poorly understood. Growing data indicate that changes in abundance or type of CSPGs (chondroitin sulfate proteoglycans) in the ECM (extracellular matrix) can influence synaptic structure and plasticity. The purpose of this study was to identify changes in synaptic structure in the hippocampus in a model of DS, the Ts65Dn mouse, and to determine the relationship to proteoglycan abundance and/or cleavage and cognitive disability. We measured synaptic proteins by ELISA and changes in lectican expression and processing in the hippocampus of young and old Ts65Dn mice and LMCs (littermate controls). In young (5 months old) Ts65Dn hippocampal extracts, we found a significant increase in the postsynaptic protein PSD-95 (postsynaptic density 95) compared with LMCs. In aged (20 months old) Ts65Dn hippocampus, this increase was localized to hippocampal stratum oriens extracts compared with LMCs. Aged Ts65Dn mice exhibited impaired hippocampal-dependent spatial learning and memory in the RAWM (radial-arm water maze) and a marked increase in levels of the lectican versican V2 in stratum oriens that correlated with the number of errors made in the final RAWM block. Ts65Dn stratum oriens PNNs (perineuronal nets), an extension of the ECM enveloping mostly inhibitory interneurons, were dispersed over a larger area compared with LMC mice. Taken together, these data suggest a possible association with alterations in the ECM and inhibitory neurotransmission in the Ts65Dn hippocampus which could contribute to cognitive deficits.
Figures


Similar articles
-
Maternal choline supplementation improves spatial learning and adult hippocampal neurogenesis in the Ts65Dn mouse model of Down syndrome.Neurobiol Dis. 2013 Oct;58:92-101. doi: 10.1016/j.nbd.2013.04.016. Epub 2013 Apr 30. Neurobiol Dis. 2013. PMID: 23643842 Free PMC article.
-
Evidence that increased Kcnj6 gene dose is necessary for deficits in behavior and dentate gyrus synaptic plasticity in the Ts65Dn mouse model of Down syndrome.Neurobiol Dis. 2017 Jul;103:1-10. doi: 10.1016/j.nbd.2017.03.009. Epub 2017 Mar 22. Neurobiol Dis. 2017. PMID: 28342823 Free PMC article.
-
Normalization of Dyrk1A expression by AAV2/1-shDyrk1A attenuates hippocampal-dependent defects in the Ts65Dn mouse model of Down syndrome.Neurobiol Dis. 2013 Apr;52:117-27. doi: 10.1016/j.nbd.2012.11.017. Epub 2012 Dec 5. Neurobiol Dis. 2013. PMID: 23220201
-
From abnormal hippocampal synaptic plasticity in down syndrome mouse models to cognitive disability in down syndrome.Neural Plast. 2012;2012:101542. doi: 10.1155/2012/101542. Epub 2012 Jul 12. Neural Plast. 2012. PMID: 22848844 Free PMC article. Review.
-
Neurodevelopmental Abnormalities in Down Syndrome: Assessing Structural and Functional Deficits.Cureus. 2024 Dec 21;16(12):e76156. doi: 10.7759/cureus.76156. eCollection 2024 Dec. Cureus. 2024. PMID: 39845250 Free PMC article. Review.
Cited by
-
Lectican proteoglycans, their cleaving metalloproteinases, and plasticity in the central nervous system extracellular microenvironment.Neuroscience. 2012 Aug 16;217:6-18. doi: 10.1016/j.neuroscience.2012.05.034. Epub 2012 May 22. Neuroscience. 2012. PMID: 22626649 Free PMC article. Review.
-
Selective decline of synaptic protein levels in the frontal cortex of female mice deficient in the extracellular metalloproteinase ADAMTS1.PLoS One. 2012;7(10):e47226. doi: 10.1371/journal.pone.0047226. Epub 2012 Oct 11. PLoS One. 2012. PMID: 23071766 Free PMC article.
-
Maternal choline supplementation improves spatial learning and adult hippocampal neurogenesis in the Ts65Dn mouse model of Down syndrome.Neurobiol Dis. 2013 Oct;58:92-101. doi: 10.1016/j.nbd.2013.04.016. Epub 2013 Apr 30. Neurobiol Dis. 2013. PMID: 23643842 Free PMC article.
-
Maternal choline supplementation improves spatial mapping and increases basal forebrain cholinergic neuron number and size in aged Ts65Dn mice.Neurobiol Dis. 2014 Oct;70:32-42. doi: 10.1016/j.nbd.2014.06.001. Epub 2014 Jun 14. Neurobiol Dis. 2014. PMID: 24932939 Free PMC article.
-
Early neurotrophic pharmacotherapy rescues developmental delay and Alzheimer's-like memory deficits in the Ts65Dn mouse model of Down syndrome.Sci Rep. 2017 Apr 3;7:45561. doi: 10.1038/srep45561. Sci Rep. 2017. PMID: 28368015 Free PMC article.
References
-
- Alamed J, Wilcock DM, Diamond DM, Gordon MN, Morgan D. Two-day radial-arm water maze learning and memory task; robust resolution of amyloid-related memory deficits in transgenic mice. Nat Protoc. 2006;1:1671–1679. - PubMed
-
- Belichenko PV, Masliah E, Kleschevnikov AM, Villar AJ, Epstein CJ, Salehi A, Mobley WC. Synaptic structural abnormalities in the Ts65Dn mouse model of Down syndrome. J Comp Neurol. 2004;480:281–298. - PubMed
-
- Belichenko PV, Kleschevnikov AM, Salehi A, Epstein CJ, Mobley WC. Synaptic and cognitive abnormalities in mouse models of Down syndrome: exploring genotype-phenotype relationships. J Comp Neurol. 2007;504:329–345. - PubMed
Publication types
MeSH terms
Substances
Grants and funding
LinkOut - more resources
Full Text Sources
Medical

