. 2012 Jan 27;36(1):43-54.
doi: 10.1016/j.immuni.2011.12.010. Epub 2012 Jan 5.

TAK1 negatively regulates NF-κB and p38 MAP kinase activation in Gr-1+CD11b+ neutrophils

Affiliations

TAK1 negatively regulates NF-κB and p38 MAP kinase activation in Gr-1+CD11b+ neutrophils

Adebusola Alagbala Ajibade et al. Immunity. .

Erratum in

  • Immunity. 2012 Jan 27;36(1):153

Abstract

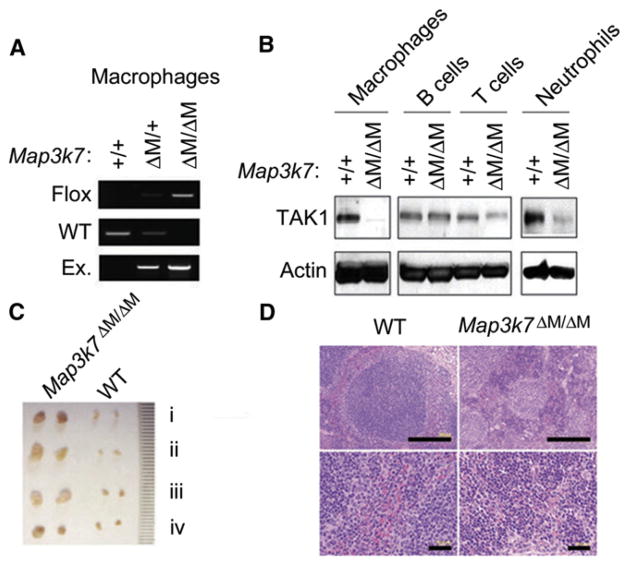
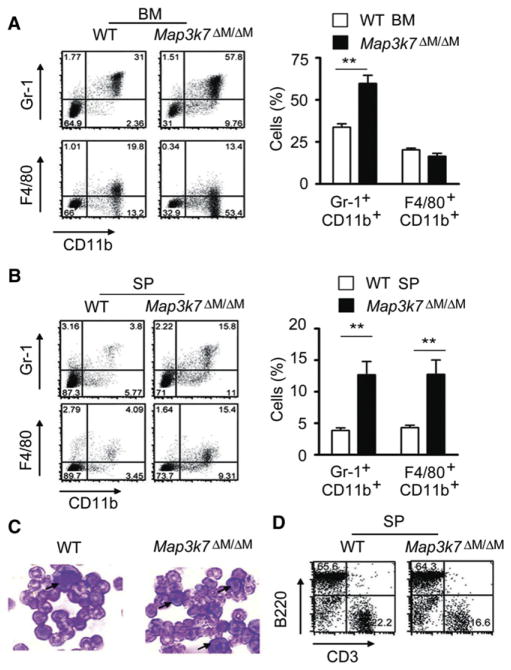
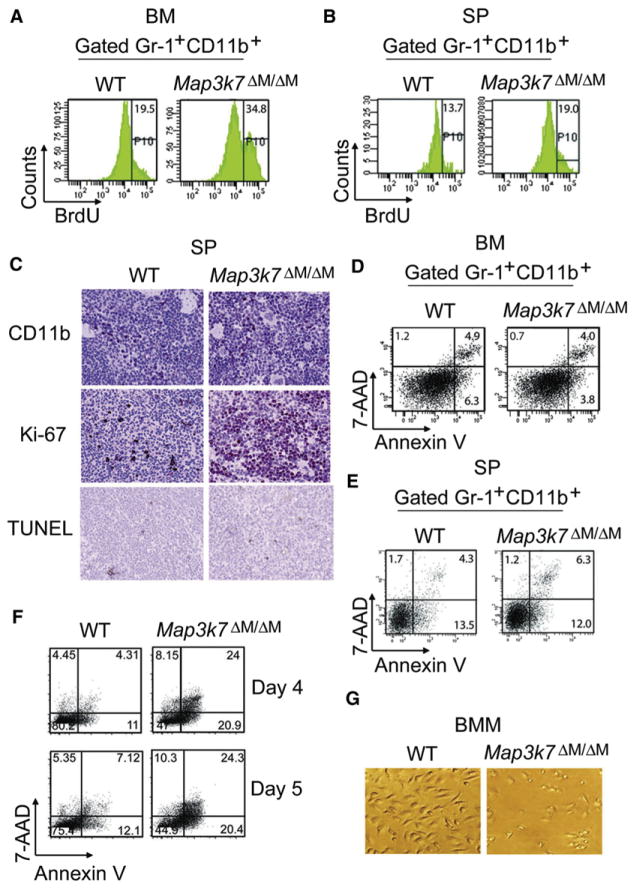
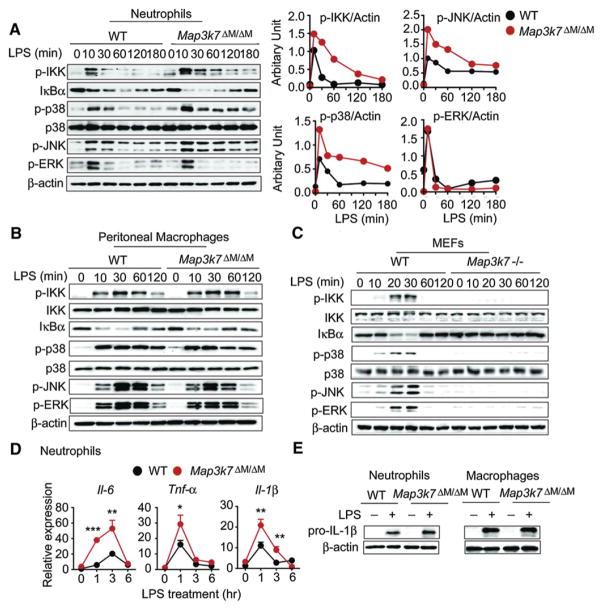
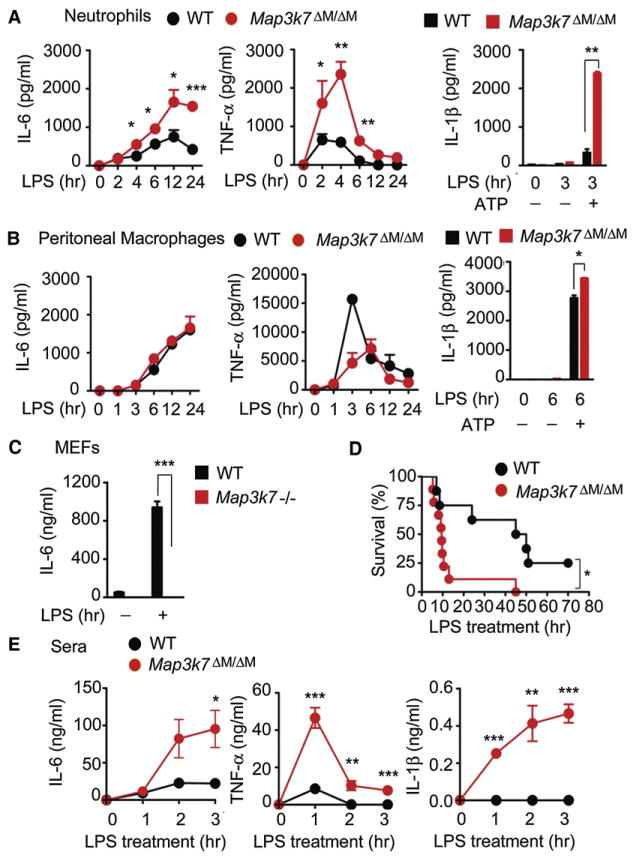
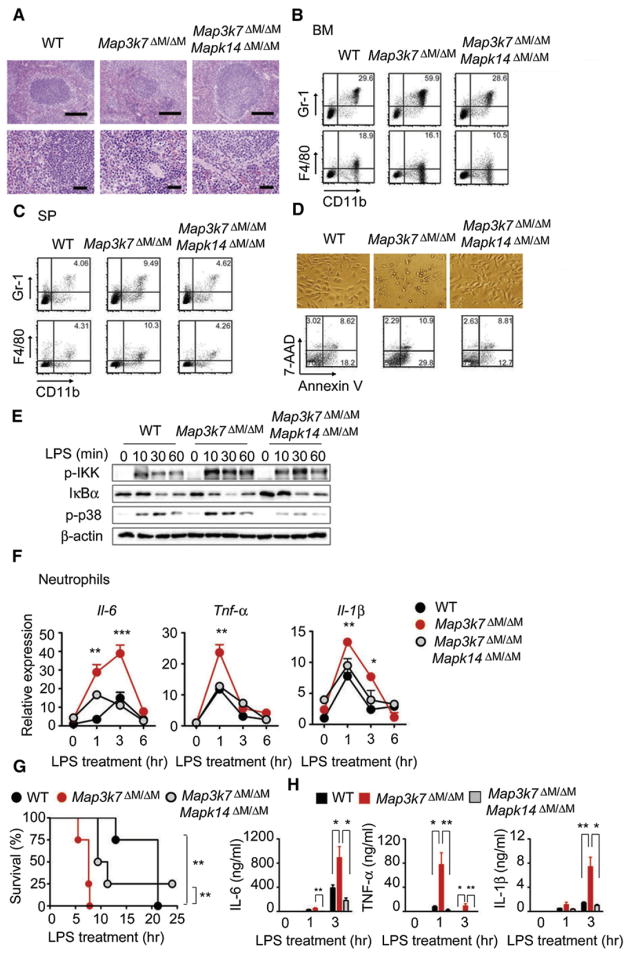
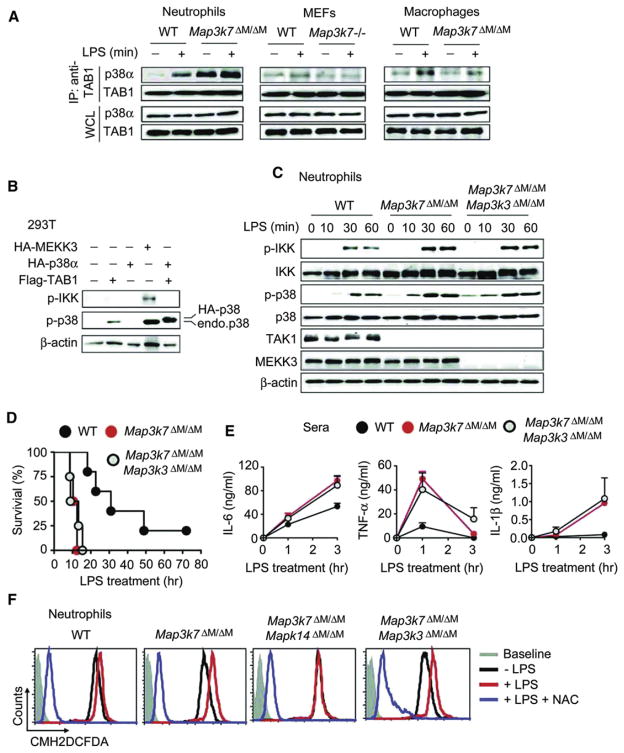
Stringent control of NF-κB and mitogen-activated protein kinase (MAPK) signaling is critical during innate immune responses. TGF-β activated kinase-1 (TAK1) is essential for NF-κB activation in T and B cells but has precisely the opposite activity in myeloid cells. Specific deletion of TAK1 (Map3k7(ΔM/ΔM)) led to development of splenomegaly and lymphomegaly associated with neutrophilia. Compared with wild-type cells, TAK1-deficient neutrophils enhanced the phosphorylation of the kinases IKK, p38, and JNK and the production of interleukin-1β (IL-1β), IL-6, tumor necrosis factor-α (TNF-α), and reactive oxygen species (ROS) after lipopolysaccharide (LPS) stimulation. Map3k7(ΔM/ΔM) mice were significantly more susceptible to LPS-induced septic shock and produced higher amounts of IL-1β, IL-6, and TNF-α in plasma than do wild-type mice. Specific ablation of p38 rescued the phenotype and functional properties of Map3k7(ΔM/ΔM) mice. Our findings identify a previously unrecognized role of TAK1 as a negative regulator of p38 and IKK activation in a cell type-specific manner.


Figures

Figure 1
Figure 1. Characterization and Phenotypic Analysis of Map3k7ΔM/ΔM Mice
(A) PCR analysis of Map3k7 deletion with macrophages from WT and Map3k7ΔM/ΔM mice. (B) Immunoblot analysis of TAK1 protein expression with anti-TAK1 in macrophages, B cells, T cells, and neutrophils. (C) Lymphadenopathy in Map3k7ΔM/ΔM mice compared with WT control. Inguinal (i), axillary (ii), superficial cervical (iii), and mesenteric (iv) lymph nodes were examined. (D) H&E staining of spleen sections from WT and Map3k7ΔM/ΔM mice. Data shown are representative of at least five independent experiments. See also Table S1 and Figure S1.
Figure 2
Figure 2. TAK1 Ablation Increases Gr-1+CD11b+ Neutrophils in the Bone Marrow and Spleen
(A and B) Flow cytometric analysis of Gr-1+CD11b+ neutrophil and F4/80+CD11b+ macrophage populations in bone marrow (A) and spleen (B) of WT and Map3k7ΔM/ΔM mice, with anti-Gr-1, anti-F4/80, and anti-CD11b. Results plotted as mean ± SD. **p < 0.01. BM, bone marrow; SP, spleen. (C) Bone marrow smear and Wright-Giemsa staining of bone marrow cells visualized by light microscopy. (D) T and B lymphocyte analysis in spleen via anti-CD3 and anti-B220 staining and flow cytometry. Results are representative of at least four independent experiments. See also Figure S1.
Figure 3
Figure 3. Proliferation and Apoptosis Analyses of TAK1-Deficient Neutrophils and Macrophages
(A and B) BrdU pulse labeling of mice and flow cytometric analysis of bone marrow (A) and spleen (B) cells via anti-BrdU. Gr-1+CD11b+ cells were gated to determine the percentage of BrdU-positive cells. (C) Immunohistochemistry was performed on spleen tissues with anti-CD11b and anti-Ki-67, and TUNEL staining was done to detect apoptotic cells. (D–F) Apoptosis was assayed with Annexin V/7-AAD apoptosis staining and flow cytometry analysis of bone marrow (D), spleen (E), and bone-marrow-derived macrophages (BMM) cultured with 10% M-CSF conditioned medium (F). Gr-1+CD11b+ bone marrow and spleen cells and F4/80+CD11b+ BMM cells were gated to determine percentage of apoptotic cells. (G) Photographs of BMM were visualized by light microscopy. Results are representative of at least five independent experiments. See also Figure S2.
Figure 4
Figure 4. Effects of Map3k7 Ablation on NF-κB and MAPK Signaling Pathways Is Cell Type Specific
(A–C) WT or TAK1-deficient neutrophils (A), peritoneal macrophages (B), or MEFs (C) were treated with LPS for the indicated time points, followed by immunoblot analysis of phosphorylated IKK (P-IKK), P-p38, P-JNK, P-ERK, p38, and IκBα with cell lysates. (A) Right: Quantitative comparison of activation of signaling molecules between WT or Map3k7ΔM/ΔM neutrophils by densitometric scanning of blots. (D) IL-6, TNF-α, and IL-1β mRNA expression in neutrophils treated with LPS (100 ng/ml) for indicated time points determined by real-time PCR. Results are plotted as mean ± SD. *p < 0.05; **p < 0.01; ***p < 0.001. (E) Immunoblot analysis of pro-IL1β in neutrophils and macrophages treated with LPS for 2 hr and 6 hr, respectively. Results are representative of at least five independent experiments. See also Figure S2.
Figure 5
Figure 5. Effects of TAK1 Ablation on Proinflammatory Cytokine Production in a Cell Type-Specific Manner
(A and B) IL-6, TNF-α, and IL-1β secretion by neutrophils (A) or peritoneal macrophages (B) treated with or without LPS (100 ng/ml) for indicated time points was measured by ELISA. IL-1β production was stimulated with ATP (5 mM) for 1 hr. (C) ELISA measurement of IL-6 production by MEFs after LPS (1 μg/ml) treatment for 24 hr. (D) Survival of WT and Map3k7ΔM/ΔM mice (n = 10 per group) after high-dose LPS (30 mg/kg) challenge. (E) Plasma concentrations of IL-6, TNF-α, and IL-1β in mice at various times after LPS treatment. Data shown are the mean ± SD. *p < 0.05; **p < 0.01; ***p < 0.001. Data shown are representative of at least five independent experiments. See also Figure S2.
Figure 6
Figure 6. p38 Ablation Rescues Splenomegaly Phenotype and Increased Proinflammatory Signaling in TAK1-Deficient Mice
(A) H&E staining of spleen sections from WT, Map3k7ΔM/ΔM, and Map3k7ΔM/ΔMMapk14ΔM/ΔM mice. Top, 100× magnification; bottom, 400× magnification. (B and C) FACS analysis of Gr-1+CD11b+ neutrophils and F4/80+CD11b+ macrophages in bone marrows (B) and spleens (C) from WT, Map3k7ΔM/ΔM, and Map3k7ΔM/ΔMMapk14ΔM/ΔM mice. (D) Photographs of cultured BMM were visualized by light microscopy and apoptotic cells were analyzed by Annexin V/7-AAD staining and flow cytometry. Results are representative of at least three independent experiments. (E) Immunoblot analysis of P-IKK, IκBα, and P-p38 in neutrophils treated with LPS for the indicated time points. (F) Real-time PCR analysis of IL-6, TNF-α, and IL-1β mRNA expression in neutrophils treated with LPS for the indicated time points. (G) Survival of WT (n = 4), Map3k7ΔM/ΔM (n = 4), and Map3k7ΔM/ΔMMapk14ΔM/ΔM (n = 4) mice treated with high-dose LPS (30 mg/kg). (H) Serum concentrations of IL-6, TNF-α, and IL-1β were measured at 1 and 3 hr after LPS challenge. Data shown in (G) and (H) are the mean ± SD. *p < 0.05; **p < 0.01; ***p < 0.001. Data shown are representative of at least five independent experiments. See also Figure S3.
Figure 7
Figure 7. Multiple Pathways Are Involved in p38 Activation in TAK1-Deficient Neutrophils
(A) Interaction between TAB1 and p38 in neutrophils, peritoneal macrophages, and MEFs. Cells were treated with or without LPS for 15 min and cell lysates were immunoprecipitated (IP) with anti-TAB1 followed by immunoblotting with anti-p38α and anti-TAB1. (B) 293T cells were transfected with Flag-TAB1, HA-p38α, HA-MEKK3, or empty vector alone, followed by immunoblot analysis of cell lysates with indicated antibodies. (C) WT, Map3k7ΔM/ΔM, and Map3k7ΔM/ΔMMap3k3ΔM/ΔM neutrophils were treated with LPS, and cell lysates were immunoblotted with indicated antibodies. (D) Survival of WT (n = 5), Map3k7ΔM/ΔM (n = 4), and Map3k7ΔM/ΔMMap3k3ΔM/ΔM (n = 4) mice treated with high-dose LPS (25 mg/kg). Serum concentrations of IL-6, TNF-α, and IL-1β were measured at 0, 1, and 3 hr after LPS injection. (E) Serum concentrations of IL-6, TNF-α, and IL-1β were measured at 1 hr and 3 hr after LPS challenge. (F) WT, Map3k7ΔM/ΔM, Map3k7ΔM/ΔMMapk14ΔM/ΔM, and Map3k7ΔM/ΔMMap3k3ΔM/ΔM neutrophils were pretreated with or without NAC (5 mM) for 30 min followed by LPS stimulation for 3 hr. ROS production was measured by staining cells with CM-H2DCFDA for 30 min followed by flow cytometry. Results are representative of at least three independent experiments. See also Figure S4.

References

    1. Adhikari A, Xu M, Chen ZJ. Ubiquitin-mediated activation of TAK1 and IKK. Oncogene. 2007;26:3214–3226. - PubMed
    1. Akira S, Uematsu S, Takeuchi O. Pathogen recognition and innate immunity. Cell. 2006;124:783–801. - PubMed
    1. Allen IC, Moore CB, Schneider M, Lei Y, Davis BK, Scull MA, Gris D, Roney KE, Zimmermann AG, Bowzard JB, et al. NLRX1 protein attenuates inflammatory responses to infection by interfering with the RIG-I-MAVS and TRAF6-NF-κB signaling pathways. Immunity. 2011;34:854–865. - PMC - PubMed
    1. Asehnoune K, Strassheim D, Mitra S, Kim JY, Abraham E. Involvement of reactive oxygen species in Toll-like receptor 4-dependent activation of NF-kappa B. J Immunol. 2004;172:2522–2529. - PubMed
    1. Bettermann K, Vucur M, Haybaeck J, Koppe C, Janssen J, Heymann F, Weber A, Weiskirchen R, Liedtke C, Gassler N, et al. TAK1 suppresses a NEMO-dependent but NF-kappaB-independent pathway to liver cancer. Cancer Cell. 2010;17:481–496. - PubMed

Publication types

MeSH terms