. 2012 Apr;135(Pt 4):1308-20.
doi: 10.1093/brain/awr340. Epub 2012 Jan 5.

Recovery of cortical effective connectivity and recovery of consciousness in vegetative patients

Affiliations

Recovery of cortical effective connectivity and recovery of consciousness in vegetative patients

Mario Rosanova et al. Brain. 2012 Apr.

Abstract

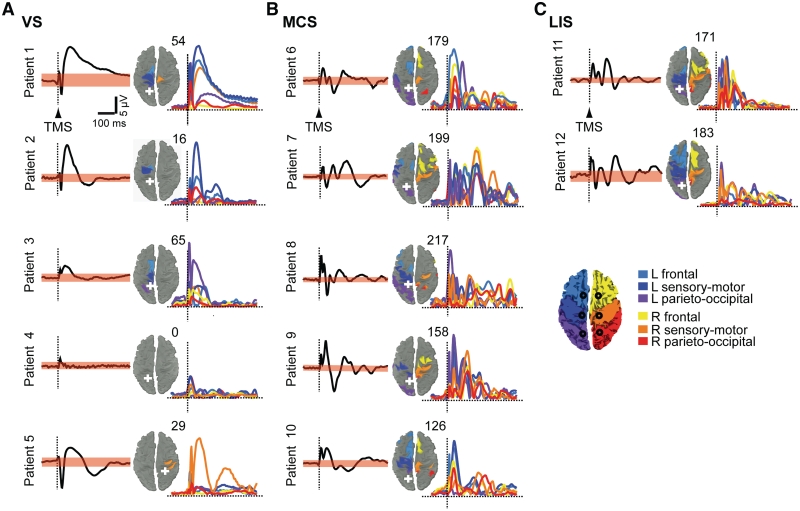
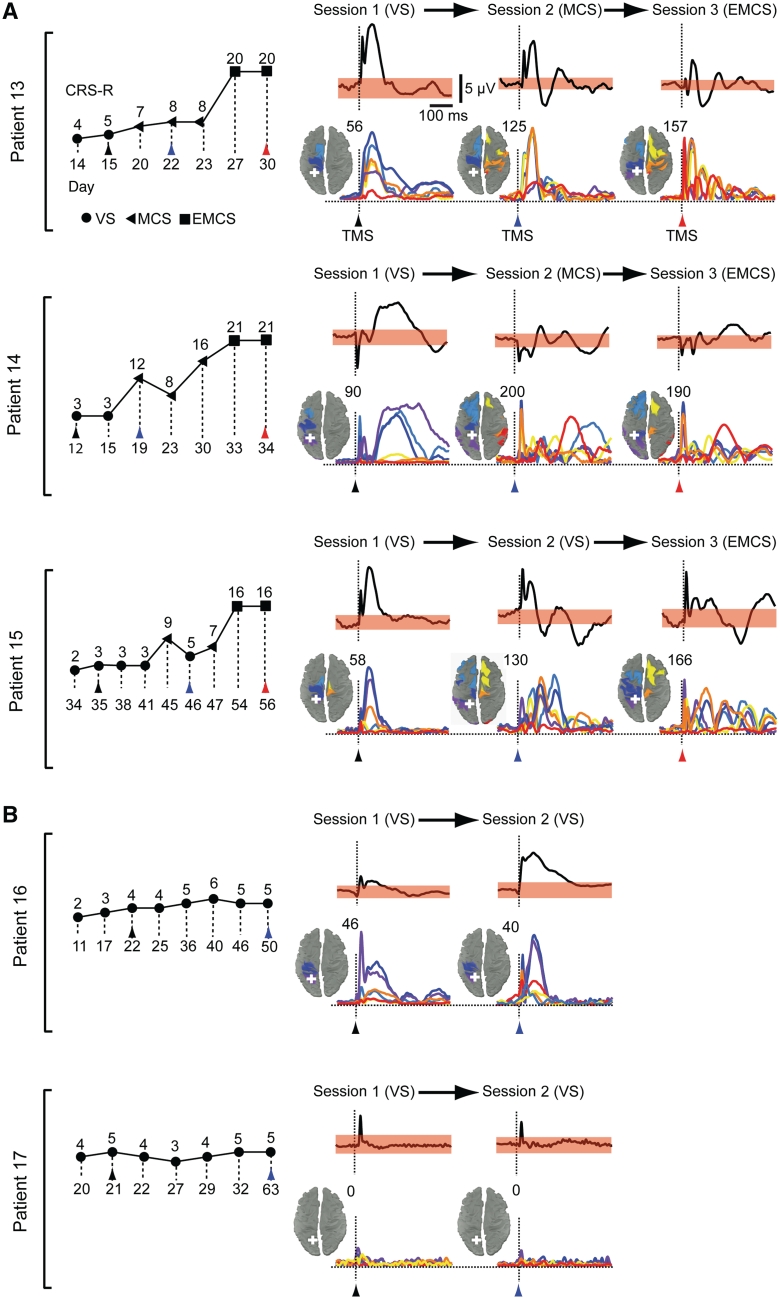
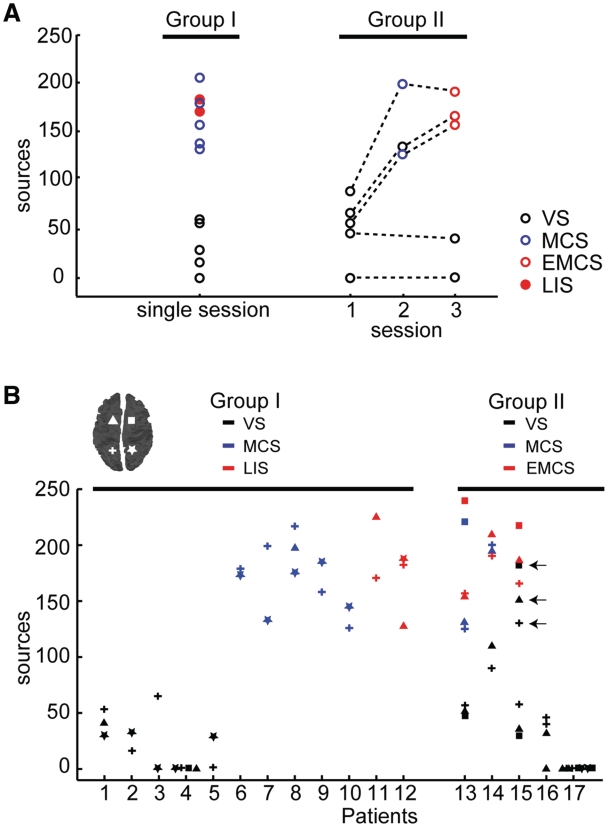
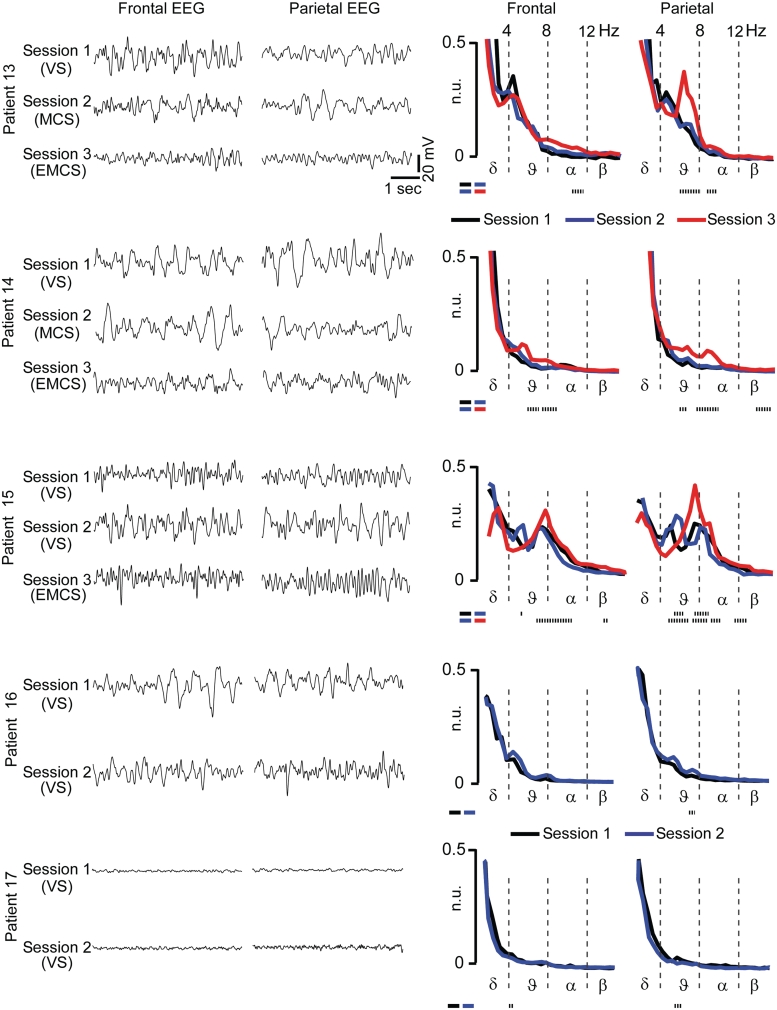
Patients surviving severe brain injury may regain consciousness without recovering their ability to understand, move and communicate. Recently, electrophysiological and neuroimaging approaches, employing simple sensory stimulations or verbal commands, have proven useful in detecting higher order processing and, in some cases, in establishing some degree of communication in brain-injured subjects with severe impairment of motor function. To complement these approaches, it would be useful to develop methods to detect recovery of consciousness in ways that do not depend on the integrity of sensory pathways or on the subject's ability to comprehend or carry out instructions. As suggested by theoretical and experimental work, a key requirement for consciousness is that multiple, specialized cortical areas can engage in rapid causal interactions (effective connectivity). Here, we employ transcranial magnetic stimulation together with high-density electroencephalography to evaluate effective connectivity at the bedside of severely brain injured, non-communicating subjects. In patients in a vegetative state, who were open-eyed, behaviourally awake but unresponsive, transcranial magnetic stimulation triggered a simple, local response indicating a breakdown of effective connectivity, similar to the one previously observed in unconscious sleeping or anaesthetized subjects. In contrast, in minimally conscious patients, who showed fluctuating signs of non-reflexive behaviour, transcranial magnetic stimulation invariably triggered complex activations that sequentially involved distant cortical areas ipsi- and contralateral to the site of stimulation, similar to activations we recorded in locked-in, conscious patients. Longitudinal measurements performed in patients who gradually recovered consciousness revealed that this clear-cut change in effective connectivity could occur at an early stage, before reliable communication was established with the subject and before the spontaneous electroencephalogram showed significant modifications. Measurements of effective connectivity by means of transcranial magnetic stimulation combined with electroencephalography can be performed at the bedside while by-passing subcortical afferent and efferent pathways, and without requiring active participation of subjects or language comprehension; hence, they offer an effective way to detect and track recovery of consciousness in brain-injured patients who are unable to exchange information with the external environment.


Figures

Figure 1
Figure 1
TMS-evoked cortical responses in Group I patients. A group of five vegetative state (VS, A), five minimally conscious state (MCS, B), and two patients with locked-in syndrome (LIS, C) underwent one TMS/EEG session after 7 days of repeated evaluations by means of the CRS-R. For each patient, the averaged TMS-evoked potentials recorded at one electrode under the stimulator (black trace) and the respective significance threshold (upper and lower boundaries of the pink bands; bootstrap statistics, P < 0.01) are shown. The sources involved by maximum cortical currents (10 most active sources) during the significant post-stimulus period of the global mean field power are plotted on the cortical surface and colour-coded according to their location in six anatomical macro-areas as indicated in the legend; the number of detected sources is indicated at the top right of each map. The time-series (colored traces) represent TMS-evoked cortical currents recorded from an array of six sources (black circles on the cortical map in the legend) located ∼2 cm lateral to the midline, one for each macro-area (Supplementary Fig. 1). The white crosses mark the sites of stimulation. For all patients, the responses to the left parietal cortex stimulation are shown, except for one patient (Patient 5) in whom a significant response could only be detected in the right hemisphere (Supplementary Fig. 2). EEG positivity is upward. L = left; R = right.
Figure 2
Figure 2
Clinical evaluation and TMS-evoked cortical responses in Group II patients. CRS-R total scores are plotted for the patients who were studied longitudinally (Group II) and eventually emerged from a minimally conscious state (EMCS, A) or remained in a vegetative state (VS, B); the first assessment (Session 1) was carried out 48 h after withdrawal of sedation, as patients exited from coma. The symbols indicate the associated clinical diagnosis (filled circles = vegetative state; filled triangles = minimally conscious state; filled squares = emergence from minimally conscious state). Coloured arrow tips mark the days when TMS/EEG recordings were performed and the time of TMS delivery (black = Session 1; blue = Session 2; red = Session 3). For every patient and measurement, averaged potentials triggered by TMS (vertical dashed lines) of parietal cortex and recorded from the electrode under the stimulator are shown. The corresponding spread and the time-course of the cortical currents evoked by TMS is measured. The sources involved by maximum neuronal currents during the significant post-stimulus period are plotted on the cortical surface and colour-coded according to their location in six anatomical macro-areas (Fig. 1); the number of detected sources is indicated at the top right of each map. The time-series represent TMS-evoked cortical currents recorded from an array of six sources (see their locations in Fig. 1) located ∼2 cm lateral to the midline, one for each macro-area. The white crosses mark the sites of stimulation; in each patient, the left parietal cortex was stimulated when patients entered a vegetative state from coma (Session 1), soon after transition to a minimally conscious state or at least 30 days of permanence in a vegetative state (Session 2) and after emergence from a minimally conscious state (Session 3), when subjects recovered functional communication. See Supplementary Fig. 3 for the remaining cortical sites targeted in patients from Group II. EEG positivity is upward.
Figure 3
Figure 3
Effective connectivity for all patients and TMS/EEG measurements. (A) For each patient and TMS/EEG measurement (same measurements as Figs 1 and 2), the number of sources involved by TMS-evoked currents are plotted. The circles indicate the clinical diagnosis at the time of recording [open black circles for vegetative state (VS); open blue circles for minimally conscious state (MCS); open red circles for emergence from minimally conscious state (EMCS) and filled red circles for locked-in syndrome (LIS)]. (B) The number of cortical sources involved by maximum cortical currents detected in all TMS/EEG measurements (n = 72) is plotted for all patients (Group I on the left and Group II on the right). Each value refers to one cortical target and is marked according to both the site of stimulation (the correspondence between symbols and stimulation sites is graphically reported on the cortical map in the left upper corner) and the CRS-R diagnosis at the time of recording (black for vegetative state; blue for minimally conscious state; red for locked-in syndrome in Group I and emergence from minimally conscious state in Group II). In all cases, effective connectivity is higher in patients who showed some level of consciousness (minimally conscious state, emergence from minimally conscious state and locked-in syndrome) compared to patients in a vegetative state. An exception is represented by the three measurements (left parietal, left frontal, right frontal) performed in Patient 15 during Session 2 (open black circles indicated by arrows). This patient was diagnosed as being in a minimally conscious state the day before the measurement, slipped back into a behavioural vegetative state on the day of Session 2 and within days, was reassessed clinically as being in a minimally conscious state and then emerged from minimally conscious state (during Session 3). Effective connectivity was null in the two anoxic subjects (Patient 4 from Group I and Patient 17 from Group II).
Figure 4
Figure 4
EEG spectra show evident changes from minimally conscious state (MCS) to emergence from minimally conscious state (EMCS) but not from vegetative state (VS) to minimally conscious state. Spontaneous EEG traces (5 s) and EEG spectra (calculated on 2 min; average of 5 s epochs) are shown for the five subjects who underwent longitudinal recording sessions (Group II); in these patients, changes in the EEG spectrum were assessed statistically by means of a two-tailed paired t-test. The dotted lines at the bottom of each plot indicate the frequency bins that show statistically significant differences of power (t-test, P < 0.01). EEG positivity is upward. n.u. = normalised units.

References

    1. Adams JH, Graham DI, Jennett B. The neuropathology of the vegetative state after an acute brain insult. Brain. 2000;123:1327–38. - PubMed
    1. Akaishi R, Morishima Y, Rajeswaren VP, Aoki S, Sakai K. Stimulation of the frontal eye field reveals persistent effective connectivity after controlled behavior. J Neurosci. 2010;30:4295–305. - PMC - PubMed
    1. Alkire MT, Hudetz AG, Tononi G. Consciousness and anesthesia. Science. 2008;322:876–80. - PMC - PubMed
    1. Babiloni F, Babiloni C, Locche L, Cincotti F, Rossini PM, Carducci F. High-resolution electro-encephalogram: source estimates of Laplacian-transformed somatosensory-evoked potentials using a realistic subject head model constructed from magnetic resonance images. Med Biol Eng Comput. 2000;38:512–9. - PubMed
    1. Bardin JC, Fins JJ, Katz DI, Hersh J, Heier LA, Tabelow K, et al. Dissociations between behavioural and functional magnetic resonance imaging-based evaluations of cognitive function after brain injury. Brain. 2011;134:769–82. - PMC - PubMed

Publication types

MeSH terms