. 2012 Feb 15;188(4):1970-80.
doi: 10.4049/jimmunol.1102383. Epub 2012 Jan 6.

Matrix metalloproteinase-dependent microsomal prostaglandin E synthase-1 expression in macrophages: role of TNF-α and the EP4 prostanoid receptor

Affiliations

Matrix metalloproteinase-dependent microsomal prostaglandin E synthase-1 expression in macrophages: role of TNF-α and the EP4 prostanoid receptor

K M Faisal Khan et al. J Immunol. .

Erratum in

Abstract

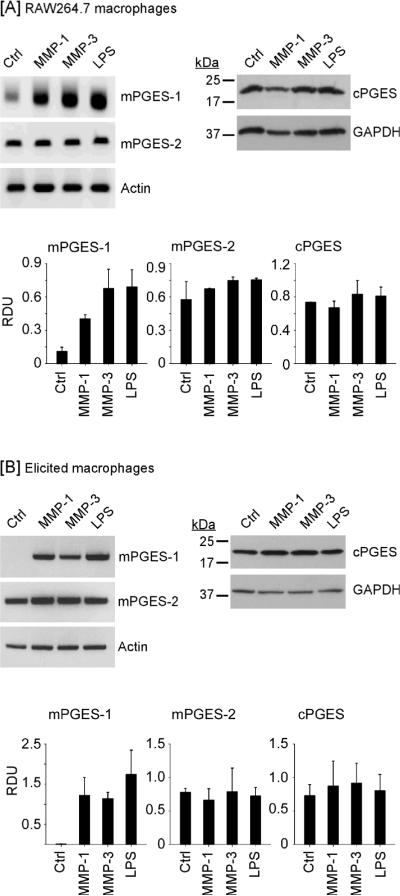
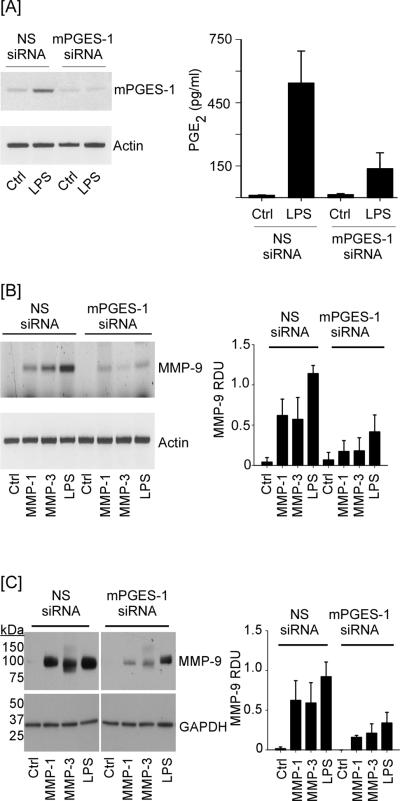
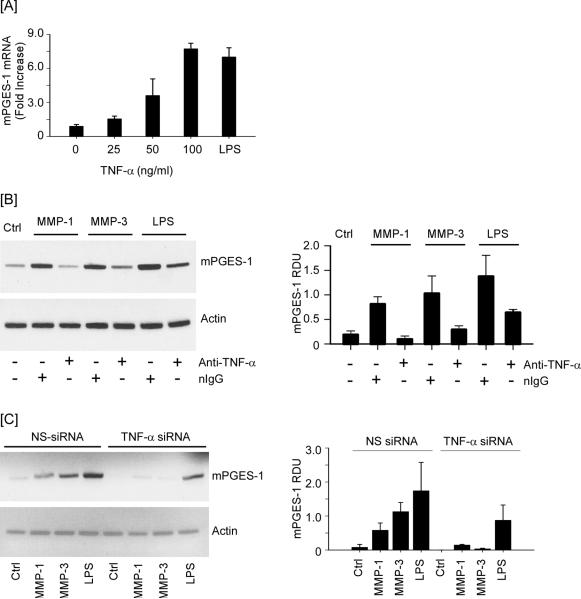
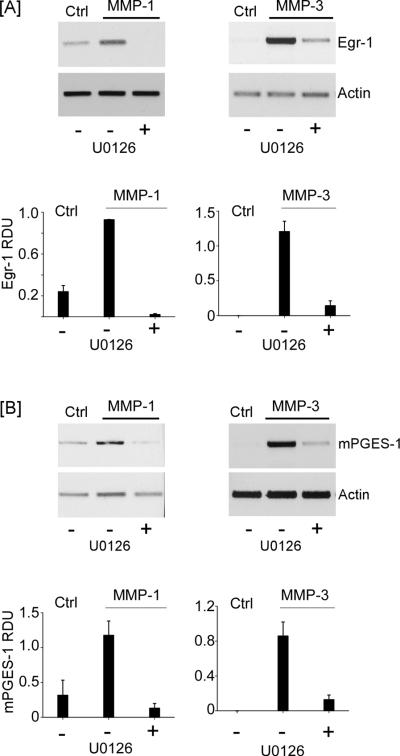
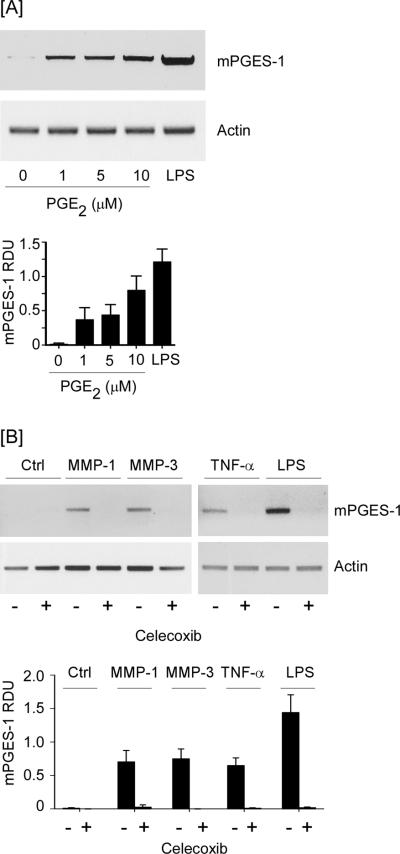
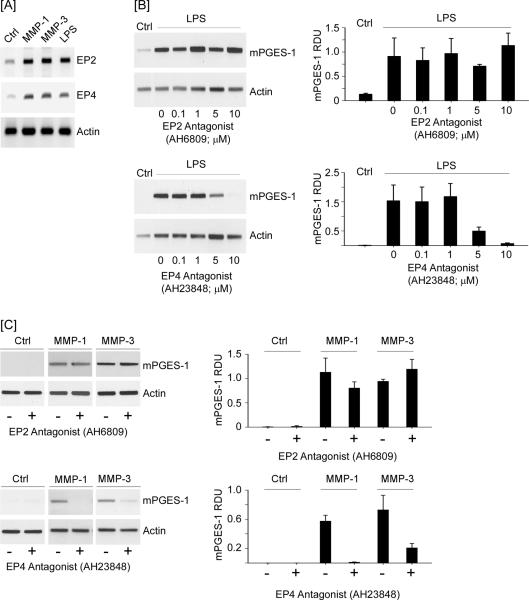
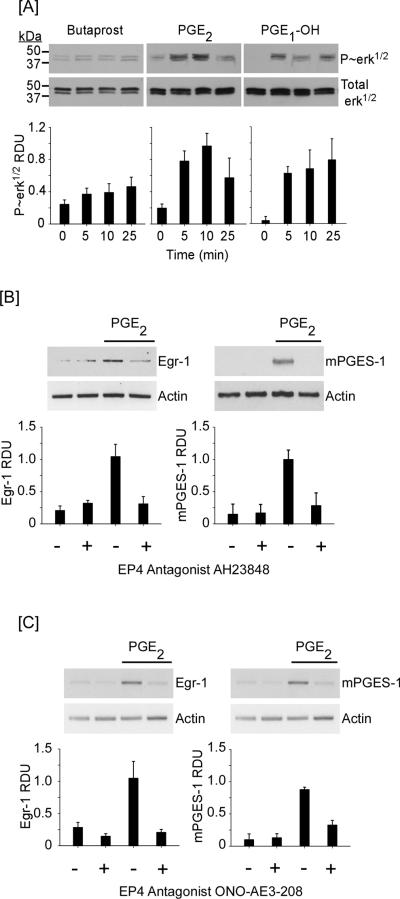
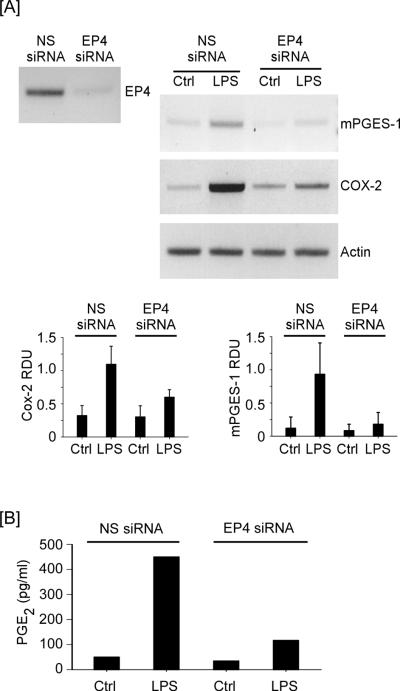
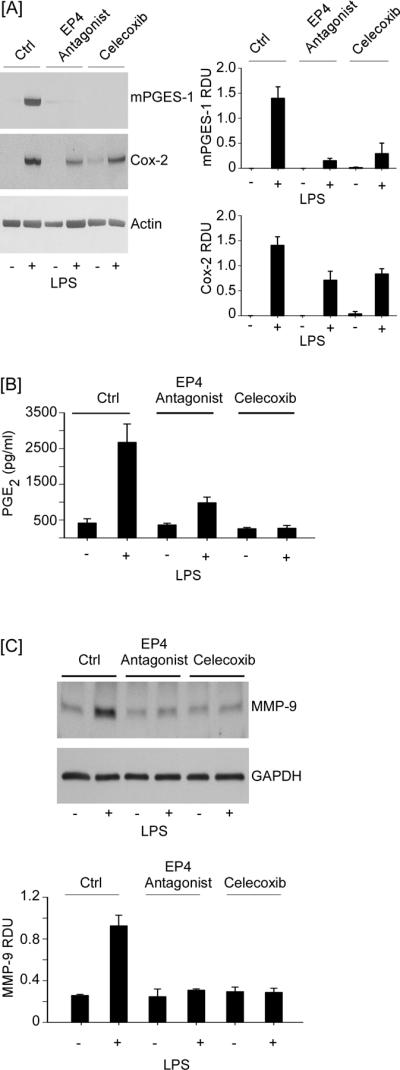
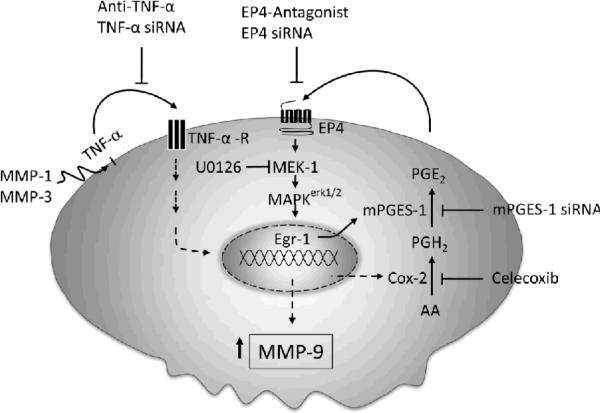
Matrix metalloproteinase (MMP)-9 contributes to the pathogenesis of chronic inflammatory diseases and cancer. Thus, identifying targetable components of signaling pathways that regulate MMP-9 expression may have broad therapeutic implications. Our previous studies revealed a nexus between metalloproteinases and prostanoids whereby MMP-1 and MMP-3, commonly found in inflammatory and neoplastic foci, stimulate macrophage MMP-9 expression via the release of TNF-α and subsequent induction of cyclooxygenase-2 and PGE(2) engagement of EP4 receptor. In the current study, we determined whether MMP-induced cyclooxygenase-2 expression was coupled to the expression of prostaglandin E synthase family members. We found that MMP-1- and MMP-3-dependent release of TNF-α induced rapid and transient expression of early growth response protein 1 in macrophages followed by sustained elevation in microsomal prostaglandin synthase 1 (mPGES-1) expression. Metalloproteinase-induced PGE(2) levels and MMP-9 expression were markedly attenuated in macrophages in which mPGES-1 was silenced, thereby identifying mPGES-1 as a therapeutic target in the regulation of MMP-9 expression. Finally, the induction of mPGES-1 was regulated, in part, through a positive feedback loop dependent on PGE(2) binding to EP4. Thus, in addition to inhibiting macrophage MMP-9 expression, EP4 antagonists emerge as potential therapy to reduce mPGES-1 expression and PGE(2) levels in inflammatory and neoplastic settings.


Figures

Figure 1
Figure 1
MMP-1 and MMP-3 induce macrophage expression of mPGES-1. [A] RAW264.7 macrophages (6-well plate; 2 × 10⁶ cells/well) or [B] thioglycollate-elicited peritoneal macrophages (12-well plate; 7.5 × 10⁵ cells/well) were incubated in DMEM-0.1% LE-BSA (Ctrl) or media containing 50nM MMP-1, MMP-3 or 10 ng/ml LPS. Following 18 h incubation, total RNA or cell lysates were recovered. Levels of mPGES-1 and mPGES-2 mRNAs were determined by PCR. Levels of cPGES and GAPDH in cell lysates were determined by Western blot. Data are representative blots and the mean levels (± SD) of target mRNAs or proteins, presented as RDUs, of 3 experiments.
Figure 2
Figure 2
mPGES-1 silencing attenuates MMP-induced MMP-9 expression. [A] RAW264.7 macrophages (24-well plate; 6 × 10⁴/well) transfected with NS or mPGES-1 siRNA were incubated 18 h with DMEM-0.1% LE-BSA (Ctrl) or media containing 10 ng/ml LPS. Total RNA and conditioned media were recovered, and levels of mPGES-1 mRNA and PGE2 were determined utilizing PCR and ELISA, respectively. PGE2 levels are the means (± SD) of 3 experiments. [B] Transfected macrophages (24-well plate; 6 × 10⁴/well) were incubated 18 h with DMEM-0.1% LE-BSA or media containing 50 nM MMP-1, MMP-3 or 10 ng/ml LPS. Total RNA was recovered and levels of MMP-9 mRNA determined. [C] Transfected macrophages (48-well plate; 3.5 × 10⁵/well) were incubated with DMEM-0.1% LE-BSA or media containing MMP-1, MMP-3 or LPS 18 h. Conditioned media and cell lysates were recovered, and levels MMP-9 and GAPDH were determined by Western blot. Data are representative blots and the mean levels (± SD) of MMP-9 mRNA or protein, presented as RDUs, of 4 and 3 experiments, respectively.
Figure 3
Figure 3
Neutralizing anti-TNF-α IgG and TNF-α silencing blocks MMP-induced mPGES-1 expression. [A] RAW264.7 macrophages (6-well plate; 2 × 10⁶ cells/well) were incubated 18 h in DMEM-0.1% LE-BSA containing 0 – 100 ng/ml recombinant murine TNF-α. Total RNA was recovered and levels of mPGES-1 mRNA were determined utilizing real time-PCR. [B] Macrophages (6-well plate; 2 × 10⁶/well) were pre-incubated 2 h with non-immune IgG1 (nIgG; 20 μg/ml) or rat monoclonal anti-mouse TNF-α IgG1 (20 μg/ml), followed by 18 h incubation with 50 nM MMP-1, MMP-3 or LPS (10 ng/ml). [C] Macrophages (6-well plate; 2 × 10⁶/well) transfected with nonspecific (NS) or TNF-α siRNA were incubated 18 h with DMEM-0.1% LE-BSA (Ctrl) or media containing MMP-1, MMP-3, or LPS. Total RNA was recovered and levels of mPGES-1 and actin mRNA were determined utilizing PCR. Data are representative blots and the mean levels (± SD) of mPGES-1mRNA, presented as RDUs, of 3 experiments.
Figure 4
Figure 4
MMP-induced Egr-1 is dependent on TNF-α. [A] RAW264.7 macrophages (12-well plate; 7 × 10⁵/well) were incubated 0 – 18 h in DMEM-0.1% LE-BSA (Ctrl), or media containing 50 nM MMP-1 or MMP-3. [B] In other experiments, macrophages (6-well plate; 2 × 10⁶/well) were pre-incubated for 2 h with non-immune IgG1 (nIgG; 20 μg/ml) or rat monoclonal anti-mouse TNF-α IgG1 (20 μg/ml), followed by 1 h incubation with 50 nM MMP-1 or MMP-3. Total RNA was isolated, and mRNA levels for Egr-1, mPGES-1 and actin were determined by PCR. Data are representative blots and the mean levels (± SD) of target mRNAs, presented as RDUs, of 3 experiments.
Figure 5
Figure 5
MMP-induced Egr-1 and mPGES-1 expression are dependent on MAPK kinase. [A] RAW264.7 macrophages (12-well plate; 5 × 10⁵/well) were incubated in DMEM-0.1% LE-BSA (Ctrl) or pre-incubated 30 min in media containing 10 μM U0126 (MAPK kinase inhibitor) followed by the addition of 50 nM MMP-1 or MMP-3, and incubated 1 h. [B] Macrophages (12-well plate; 7 × 10⁵/well) were incubated in DMEM-0.1% LE-BSA or pre-incubated 30 min in media containing 10 μM U0126 followed by the addition of 50 nM MMP-1 or MMP-3, and incubated 18 h. Total RNA was isolated, and mRNA levels for Egr-1, mPGES-1 and actin were determined by PCR. Data are representative blots and the mean levels (± SD) of target mRNAs, presented as RDUs, of 3 experiments.
Figure 6
Figure 6
MMP, TNF-α and LPS-induced mPGES-1 is dependent on Cox-2-derived PGE2. [A] RAW264.7 macrophages (12-well plate; 7 × 10⁵/well) were incubated 18 h in DMEM-0.1% LE-BSA containing 0–10 μM PGE2 or 10 ng/ml LPS. [B] Macrophages (6-well plate; 2 × 10⁶/well) were pre-incubated 30 min in DMEM-0.1% LE-BSA containing 5 μM celecoxib, and then incubated 18 h with media (Ctrl), 50 nM MMP-1 or MMP-3, 50 ng/ml TNF-α or 10 ng/ml LPS. Total RNA was isolated, and mRNA levels for mPGES-1 and actin were determined by PCR. Data are representative blots and the mean levels (± SD) of mPGES-1mRNA, presented as RDUs, of 3 experiments.
Figure 7
Figure 7
EP4 antagonist blocks LPS and MMP-induced mPGES-1 expression. [A] RAW264.7 macrophages (6-well plate; 1 × 10⁶ cells/well) were incubated in DMEM-0.1% LE-BSA alone (Ctrl), or media containing 25 nM MMP-1, MMP-3 or 10 ng/ml LPS. Following 18 h incubation, total RNA was isolated, and mRNA levels for PGE2 receptors (EP1–4) determined by PCR. [B] Macrophages were pre-incubated 30 min in DMEM-0.1% LE-BSA containing 0 – 10 μM EP2 antagonist (AH6809) or EP4 antagonist (AH23848). Following an 18 h incubation with 10 ng/ml LPS, RNA was isolated, and mRNA levels for mPGES-1 and actin were determined by PCR. [C] Macrophages were pre-incubated 30 min in DMEM-0.1% LE-BSA containing 10 μM EP2 or EP4 antagonist. Following an 18 h incubation with media alone (Ctrl), 50 nM MMP-1 or MMP-3, RNA was isolated, and mRNA levels for mPGES-1 and actin were determined by PCR. Data are representative blots and the mean levels (± SD) of mPGES-1mRNA, presented as RDUs, of 3 experiments.
Figure 8
Figure 8
PGE2 binding to EP4 triggers the activation of MAPKerk1/2 and Egr-1 and mPGES-1 expression. [A] RAW264.7 macrophages (12-well plate; 5 × 10⁵/well) were cultured in DMEM-0.1% LE-BSA for 24 h. Cells were then incubated with 10 μM butaprost (EP2 agonist), PGE2 or PGE1-OH (EP4 agonist) for 0–25 min, and lysates were prepared. Levels of phosphorylated and total MAPKerk1/2 were determined utilizing Western blot. Data are representative blots and the mean levels (± SD) of phosphorylated MAPKerk1/2 (P~erk1/2), presented as RDUs, of 3 experiments. [B,C] Macrophages (12-well plate; 5–7 × 10⁵/well) were pre-incubated 30 min in DMEM-0.1% LE-BSA or media containing EP4 antagonists AH23848 or ONO-AE2-208, followed by PGE2. Total RNA was collected at 30 min and 18 h, and mRNA levels for Egr-1, mPGES-1 and actin were determined utilizing PCR. Data are representative blots and the mean levels (± SD) of target mRNAs, presented as RDUs, of 3 experiments.
Figure 9
Figure 9
EP4 silencing reduces LPS-induced mPGES-1 and Cox-2 expression. [A] RAW264.7 macrophages transfected with nonspecific (NS) or EP4 siRNA (12-well plate; 2.5 × 10⁵ cells/well) received DMEM-0.1% LE-BSA (Ctrl) or media containing 10 ng/ml LPS, and were incubated 18 h. Total RNA was recovered and levels of mPGES-1 and Cox-2 mRNA were determined utilizing PCR. Data are representative blots and the mean levels (± SD) of target mRNAs, presented as RDUs, of 3 experiments. [B] Levels of PGE2 in conditioned media were determined utilizing ELISA, and are the mean of duplicate samples.
Figure 10
Figure 10
EP4 antagonist reduces LPS-induced PGE2 and MMP-9 levels in cultures of elicited peritoneal macrophages by attenuating mPGES-1 and Cox-2 expression. Thioglycollate-elicited macrophages (12-well plate; 7.5 × 10⁵/well) were pre-incubated 30 min with DMEM-0.01% LE-BSA (Ctrl) or media containing AH23848 or celecoxib, and then incubated 18 h with 10 ng/ml LPS. [A] Total RNA was recovered and levels of mPGES-1, Cox-2 and actin mRNA were determined utilizing PCR. [B,C] Conditioned media were recovered and levels of PGE2 and MMP-9 were determined utilizing ELISA and Western blot, respectively. Data are representative blots and the mean levels (± SD) of target mRNAs and protein, presented as RDUs, of 3 experiments. PGE2 levels are presented as the means (± SD) of 3 experiments.
Figure 11
Figure 11
MMP-1 and MMP-3 induce macrophage mPGES-1 expression: Role of TNF-α and EP4 receptor. Our data suggest that MMP-1 and MMP-3 selectively induce mPGES-1 expression, which is dependent on the release of TNF-α, activation of MAPKerk1/2 and induction of Egr-1 expression. Proteinase induced MMP-9 expression in macrophages was blocked by mPGES-1 silencing. Elevated mPGES-1 expression and PGE2 levels were regulated by a positive feedback loop that was dependent on the EP4 prostanoid receptor. Thus, in addition to inhibiting macrophage MMP-9 expression, EP4 antagonists emerge as potential therapeutic agents to reduce mPGES-1 expression and PGE2 levels in inflammatory or neoplastic settings.

Similar articles

Cited by

References

    1. Nagase H, Okada Y. Proteinases and Matrix Degradation. In: Kelly WN, Harris ED Jr., Ruddy S, Sledge CB, editors. The Textbook of Rheumatology. 5 ed. W.B.Saunders; Philadelphia: 1996. pp. 323–341.
    1. Page-McCaw A, Ewald AJ, Werb Z. Matrix metalloproteinases and the regulation of tissue remodelling. Nat. Rev. Mol. Cell Biol. 2007;8:221–233. - PMC - PubMed
    1. Opdenakker G, Van den Steen PE, Van Damme J. Gelatinase B: a tuner and amplifier of immune functions. Trends in Immunology. 2001;22:571–579. - PubMed
    1. Parks WC, Wilson CL, Lopez-Boado YS. Matrix metalloproteinases as modulators of inflammation and innate immunity. Nature Reviews Immunology. 2004;4:617–629. - PubMed
    1. Vu TH, Shipley JM, Bergers G, Berger JE, Helms JA, Hanahan D, Shapiro SD, Senior RM, Werb Z. MMP-9/gelatinase B is a key regulator of growth plate angiogenesis and apoptosis of hypertrophic chondrocytes. Cell. 1998;93:411–422. - PMC - PubMed

Publication types

MeSH terms

Substances