. 2012 Mar;137(3):269-78.
doi: 10.1007/s00418-011-0905-0. Epub 2012 Jan 7.

Complex morphology and functional dynamics of vital murine intestinal mucosa revealed by autofluorescence 2-photon microscopy

Affiliations

Complex morphology and functional dynamics of vital murine intestinal mucosa revealed by autofluorescence 2-photon microscopy

Antje Klinger et al. Histochem Cell Biol. 2012 Mar.

Abstract

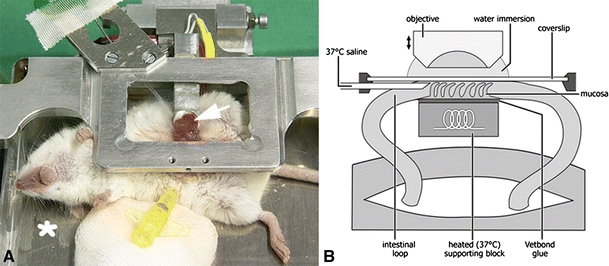
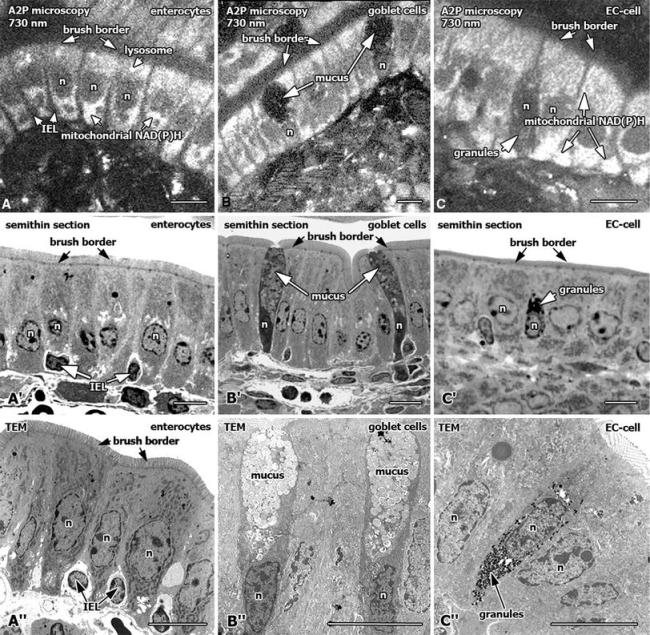
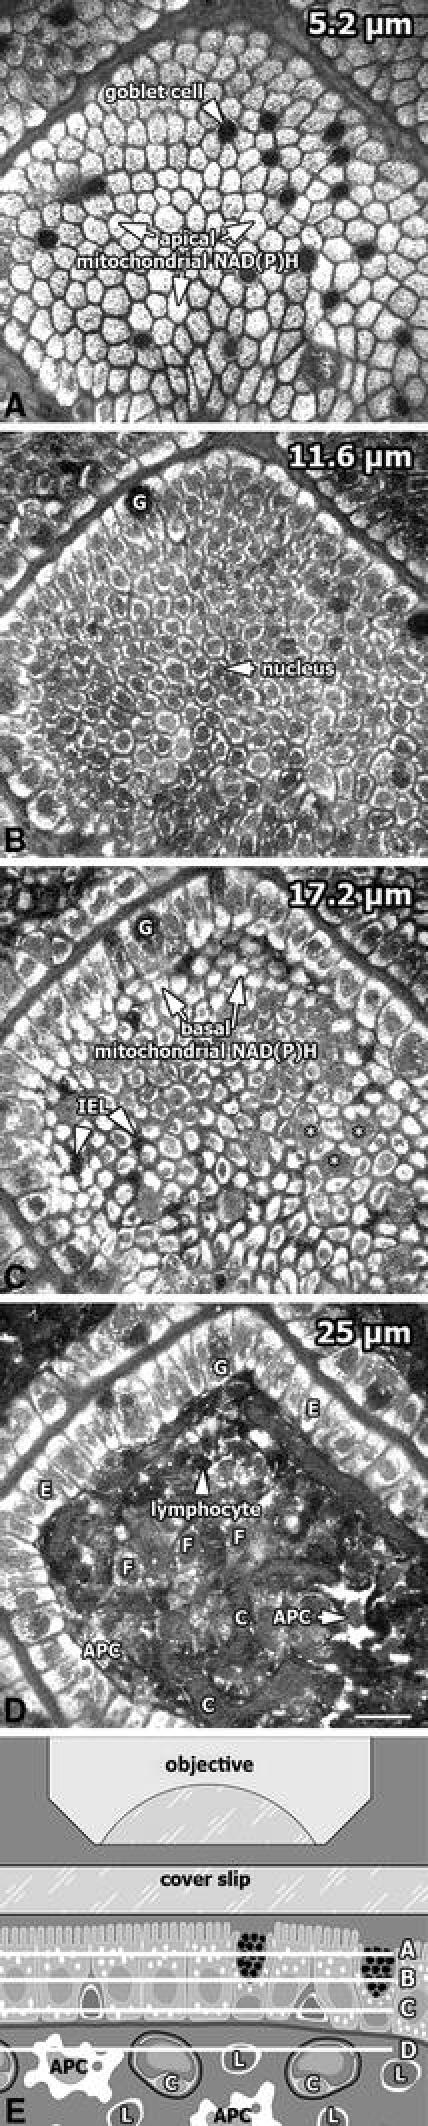
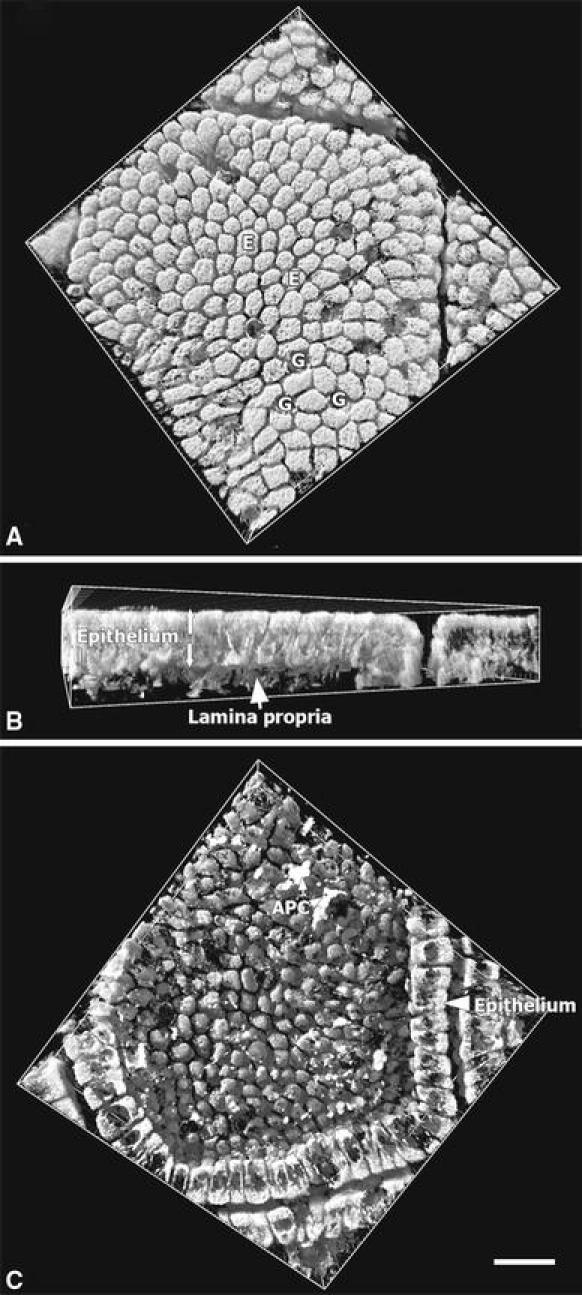
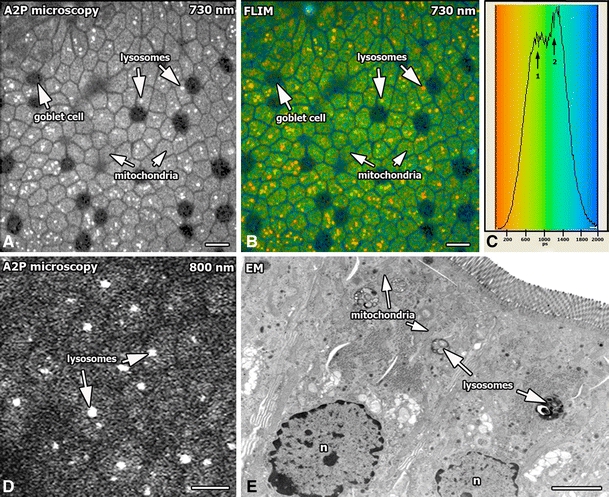
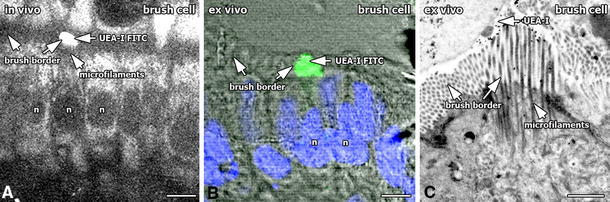
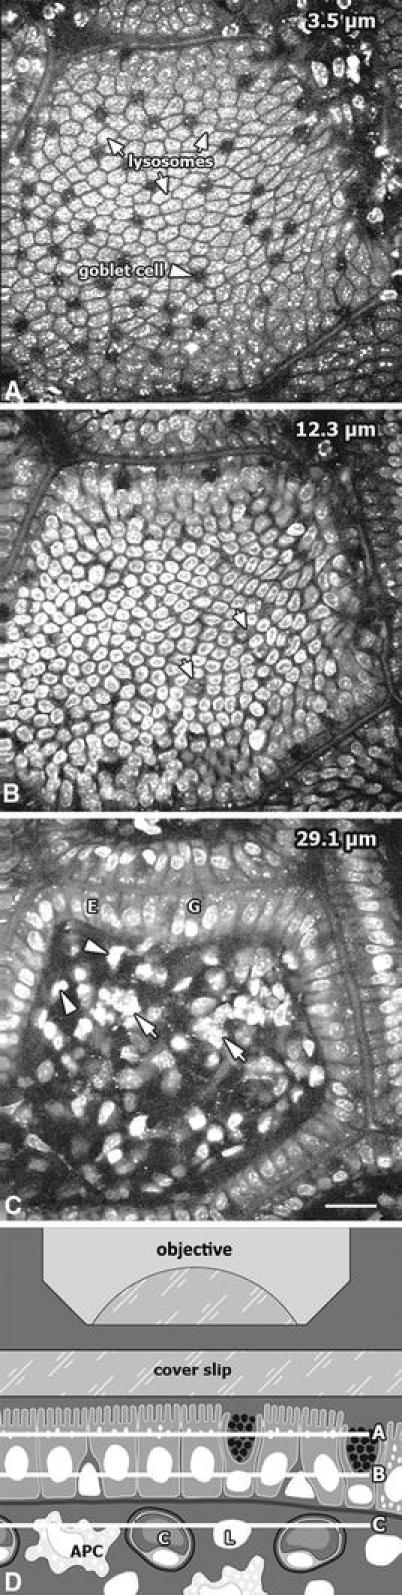
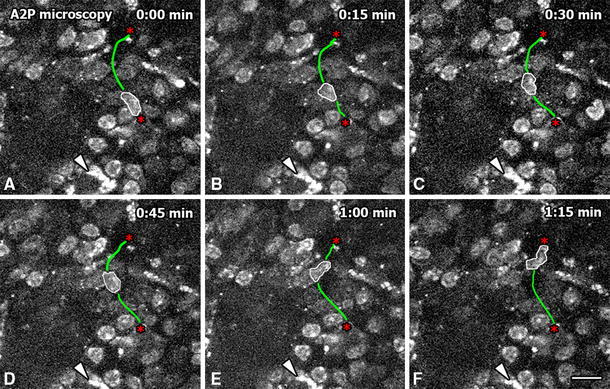
The mucosa of the gastrointestinal tract is a dynamic tissue composed of numerous cell types with complex cellular functions. Study of the vital intestinal mucosa has been hampered by lack of suitable model systems. We here present a novel animal model that enables highly resolved three-dimensional imaging of the vital murine intestine in anaesthetized mice. Using intravital autofluorescence 2-photon (A2P) microscopy we studied the choreographed interactions of enterocytes, goblet cells, enteroendocrine cells and brush cells with other cellular constituents of the small intestinal mucosa over several hours at a subcellular resolution and in three dimensions. Vigorously moving lymphoid cells and their interaction with constituent parts of the lamina propria were examined and quantitatively analyzed. Nuclear and lectin staining permitted simultaneous characterization of autofluorescence and admitted dyes and yielded additional spectral information that is crucial to the interpretation of the complex intestinal mucosa. This novel intravital approach provides detailed insights into the physiology of the small intestine and especially opens a new window for investigating cellular dynamics under nearly physiological conditions.


Figures

Fig. 1
Fig. 1
Intravital 2-photon imaging system (a). Anaesthetized balb/c mouse on a homeothermic table (asterisk) with an exteriorized ileal loop (arrow) (b). Schematic diagram of the chamber for intravital imaging. The loop of the small intestine was glued on a heated metallic block and sliced, so that the mucosa could be carefully pressed to a fixed cover slip to dampen movement artefacts. During all procedures, the small intestine was constantly moisturized with saline and core body temperature was maintained at 37°C
Fig. 2
Fig. 2
A2P images of enterocytes (a), goblet cells (b) and enteroendocrine (EC-) cells (c) in the living mucosa of small intestine. Mitochondria, cytosol and lysosomes of most epithelial cells exhibited a strong signal when excited at 730 nm. Other cellular structures, such as nuclei (n), brush border, the mucus-containing granules of goblet cells and the granules of EC-cells appeared dark. Intraepithelial lymphocytes (IEL) exhibited only a weak fluorescence. Visualization of in vivo mucosa morphology was in excellent agreement with histological observations in semithin sections (a′c′) and electron microscopic sections (a″c″). (Scale bars, 10 μm)
Fig. 3
Fig. 3
A2P images of a 25-μm thick slice of mouse small intestinal mucosa excited at 730 nm. Stack of optical sections through a villus: a 5.2 μm below the tissue surface, mitochondrial NAD(P)H in the apical cytoplasm of enterocytes exhibited a strong signal. Mucus-containing goblet cells appeared dark. b In 11.6-μm depth, the image predominantly showed the nuclei of enterocytes. Goblet cell (G). c In 17.2-μm depth, a strong signal from the basal mitochondrial NAD(P)H was exhibited and the nuclei of goblet cells (asterisk) were identified. Intraepithelial lymphocytes appeared with dark nuclei between the enterocytes (arrowheads). Goblet cell (G). d In 25-μm depth, the underlying lamina propria with fibroblasts (F), capillaries (C) and lymphoid cells, such as lymphocytes (arrowhead) and antigen-presenting cells (APC, arrow) were identified. Enterocyte (E), goblet cell (G). e Schematic diagram of the four different focus planes (ad). Lymphocytes (L), capillaries (C), antigen-presenting cell (APC) (Scale bar, 20 μm)
Fig. 4
Fig. 4
3D rendering of a 25-μm-thick slice of mouse small intestine excited at 730 nm. Image represents a 150 × 150 × 25 μm volume of a villus area a view from the luminal side of a villus with strong mitochondrial NAD(P)H signal in enterocytes (E). Mucus-containing granules of goblet cells (G) appeared dark. b Lateral view of the epithelium and underlying lamina propria. c View from the lamina propria side, showing the mitochondrial NAD(P)H signal of the basal cytoplasm and antigen-presenting cells (APC) in the lamina propria. (Scale bar, 20 μm)
Fig. 5
Fig. 5
a A2P image of the epithelium of mouse small intestine excited at 730 nm. Lysosomes in the apical cytoplasm of enterocytes. b Corresponding color-coded fluorescence lifetime image of the apical cytoplasm of the epithelium. Lysosomes (orange) could be differed from mitochondria (green) by their fluorescence lifetime. c Lysosomes exhibited an average fluorescence lifetime of 810 ps (arrow 1), whereas liefetimes of mitochondria were longer with ~1,230 ps (arrow 2). d A2P image of the epithelium excited at 800 nm. At this excitation wavelength the signal source was dominated by lysosomes in the apical cytoplasm of enterocytes. e Electron microscopic section showing mitochondria and lysosomes in the apical cytoplasm of enterocytes, nuclei (n). (Scale bars a, b, d 10 μm; e, 2 μm)
Fig. 6
Fig. 6
a A2P image of the in vivo histology of brush cells in the epithelium of mouse small intestine excited at 730 nm. The brush border of brush cells, which usually appeared dark in A2P images could be successfully labeled in vivo by luminal application of the Ulex europaeus agglutinin lectin I conjugated to FITC (UEA-I FITC). The typical microfilament rootlet bundles of brush cells appeared dark. Nuclei (n). b Confocal laser scanning microscopy of tissue section. UEA-I FITC lectin also selectively bound to the brush border of brush cells in preserved tissue. Green, UEA-I FITC; blue, nuclei (n) stained with Hoechst 33258 dye; dark gray, DIC. c On-section lectin labeling of brush cells with UEA-I using 20-nm colloidal gold to localize binding sites. The microfilament rootlet bundles extend deeply into the apical cytoplasm. (Scale bars a, b 5 μm; c, 1 μm)
Fig. 7
Fig. 7
Images of a 29.1-μm-thick stack of mouse small intestine excited at 730 nm 24 h after intravenous application of Hoechst 33258. Stack of optical sections through a villus: a in 3.5 μm below the tissue surface, highly fluorescent lysosomes (arrows) and mitochondrial NAD(P)H in the apical cytoplasm of enterocytes exhibited a strong signal. Mucus-containing goblet cells (arrowhead) appeared dark b in 12.3-μm depth, the image predominantly showed the nuclei of enterocytes, which had assimilated the Hoechst dye. Nuclei of goblet cells (arrows). c In 29.1-μm depth, the underlying lamina propria was identified. The nuclei of most contained cells assimilated the Hoechst dye. Lymphocytes, which usually show only weak fluorescence exhibited a strong labeling (arrowheads). Antigen-presenting cells (APC) were recognized by their strongly fluorescent lysosomes (arrows). Enterocyte (E), goblet cell (G) d schematic diagram of the three different focus planes (ac) shown above. Lymphocyte (L), capillary (C), antigen presenting cell (APC). (Scale bar, 20 μm)
Fig. 8
Fig. 8
af Time-lapse series of the lamina propria of mouse small intestine excited at 730 nm 24 h after intraperitoneal application of Hoechst 33258. Individual lymphocytes assimilated the Hoechst dye and could easily be identified by their stained nuclei. Using time-lapse 3D imaging, we visualized cell motility of single lymphocytes (white outline) up to 40 min. (Here shown a period of 1 min and 15 s). Lymphocytes in the lamina propria displayed average velocities of 12 μm min−1. Red asterisks mark start and end point of the track (green). Antigen presenting cell (arrowheads). (Scale bar 10 μm)

Similar articles

Cited by

References

    1. Bennett BD, Jetton TL, Ying G, Magnuson MA, Piston DW. Quantitative subcellular imaging of glucose metabolism within intact pancreatic islets. J Biol Chem. 1996;271:3647–3651. doi: 10.1074/jbc.271.7.3647. - DOI - PubMed
    1. Caldwell CC, Kojima H, Lukashev D, Armstrong J, Farber M, Apasov SG, Sitkovsky MV. Differential effects of physiologically relevant hypoxic conditions on T lymphocyte development and effector functions. J Immunol. 2001;167:6140–6149. - PubMed
    1. Denk W, Strickler JH, Webb WW. Two-photon laser scanning fluoresence microscopy. Science. 1990;248:73–76. doi: 10.1126/science.2321027. - DOI - PubMed
    1. Dunn KW, Sandoval RM, Kelly KJ, Dagher PC, Tanner GA, Atkinson SJ, Bacallao RL, Molitoris BA. Functional studies of the kidney of living animals using multicolour two-photon microscopy. Am J Physiol. 2002;283:905–916. - PubMed
    1. Gebhard A, Gebert A. Brush cells of the mouse intestine possess a specialized glycocalyx as revealed by quantitative lectin histochemistry: further evidence for a sensory function. J Histochem Cytochem. 1999;47:799–808. doi: 10.1177/002215549904700609. - DOI - PubMed

Publication types

MeSH terms

LinkOut - more resources