

Corneal and crystalline lens dimensions before and after myopia onset
- PMID: 22227914
- PMCID: PMC3288626
- DOI: 10.1097/OPX.0b013e3182418213
Corneal and crystalline lens dimensions before and after myopia onset
Abstract
Purpose: To describe corneal and crystalline lens dimensions before, during, and after myopia onset compared with age-matched emmetropic values.
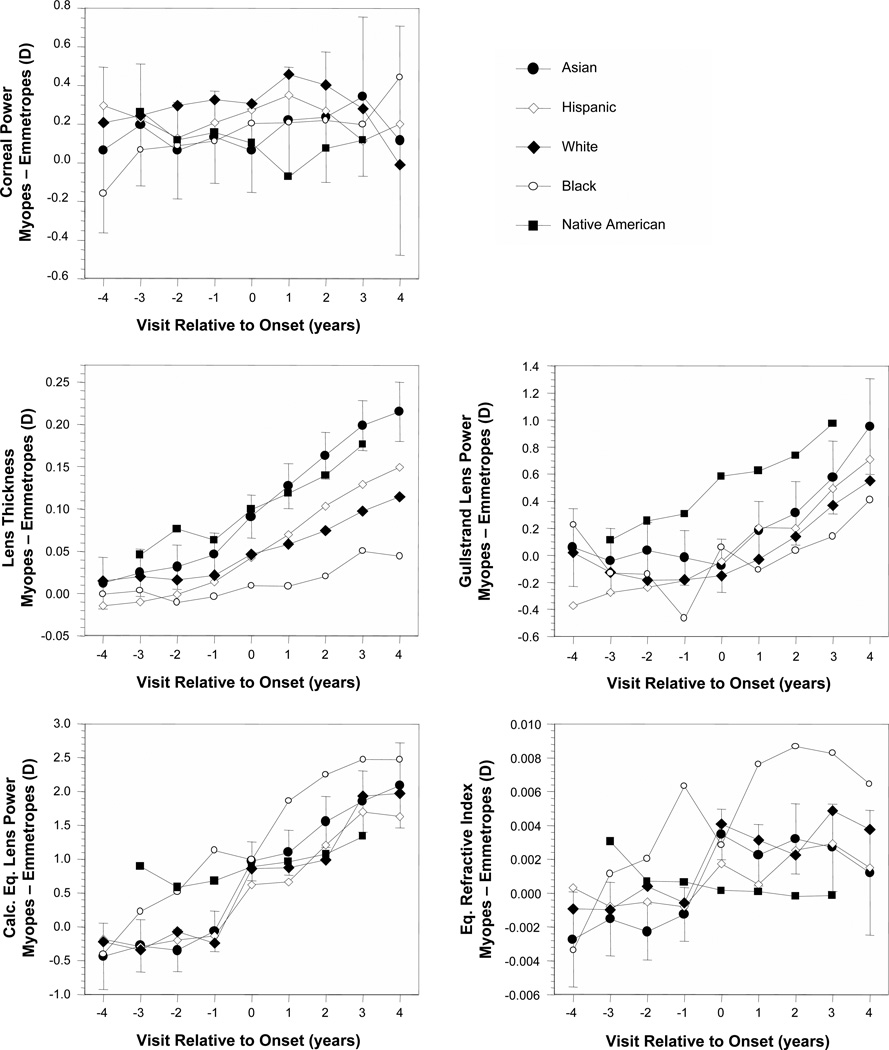
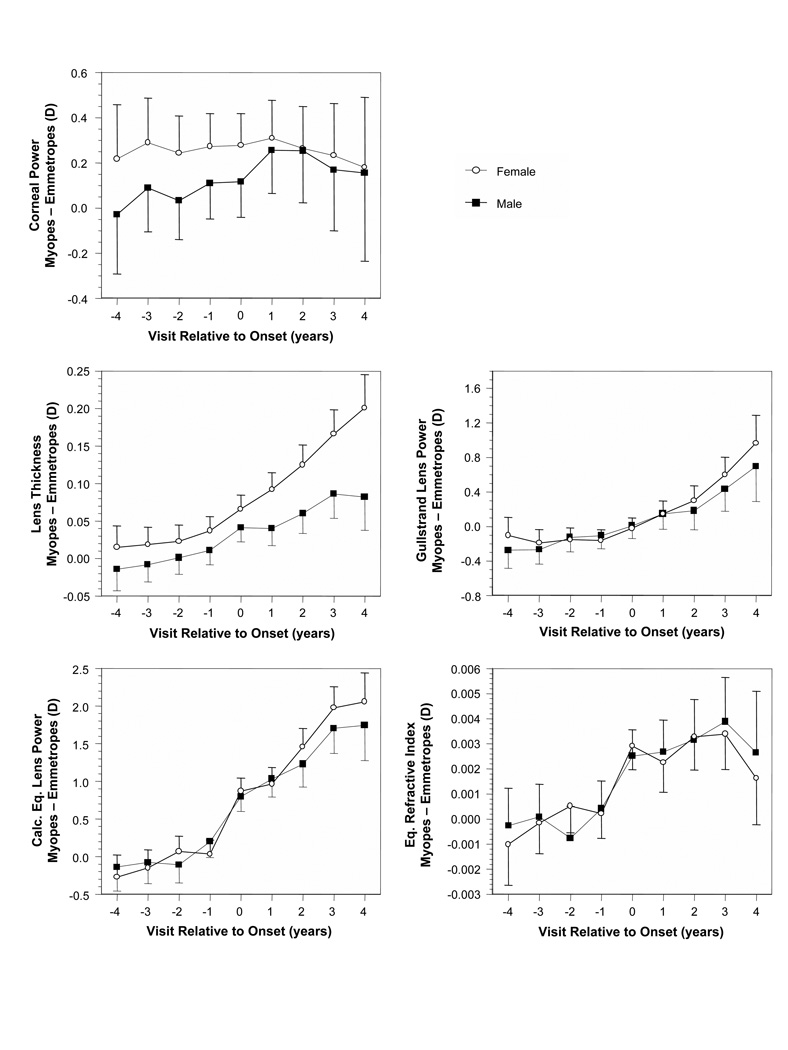
Methods: Subjects were 732 children aged 6 to 14 years who became myopic and 596 emmetropic children participating between 1989 and 2007 in the Collaborative Longitudinal Evaluation of Ethnicity and Refractive Error Study. Refractive error was measured using cycloplegic autorefraction, corneal power using a hand-held autokeratometer, crystalline lens parameters using video-based phakometry, and vitreous chamber depth (VCD) using A-scan ultrasonography. Corneal and crystalline lens parameters in children who became myopic were compared with age-, gender-, and ethnicity-matched model estimates of emmetrope values annually from 5 years before through 5 years after the onset of myopia. The comparison was made without and then with statistical adjustment of emmetrope component values to compensate for the effects of longer VCDs in children who became myopic.
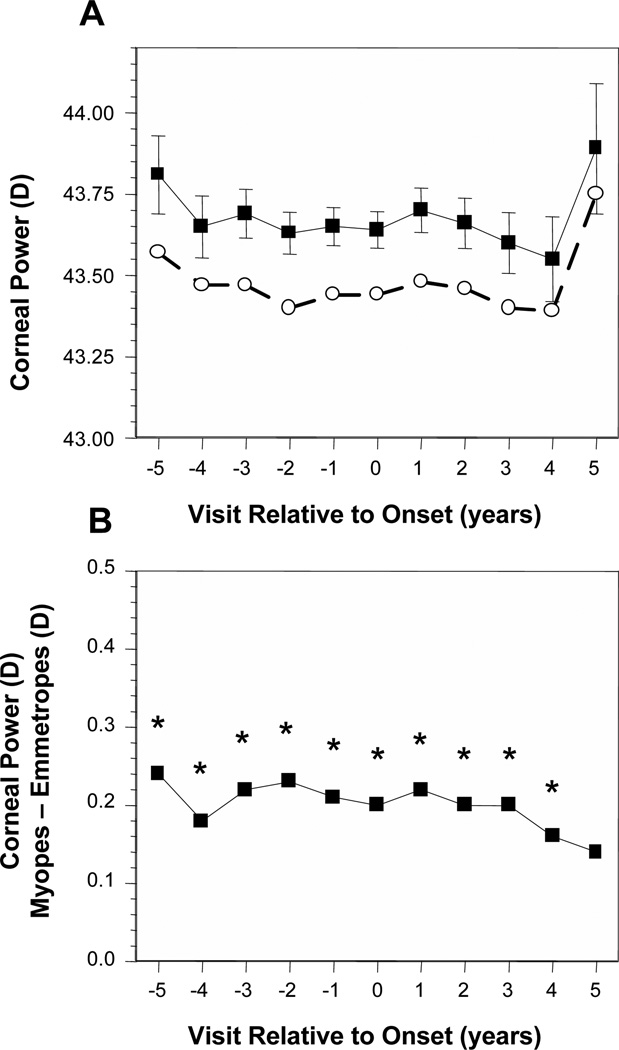
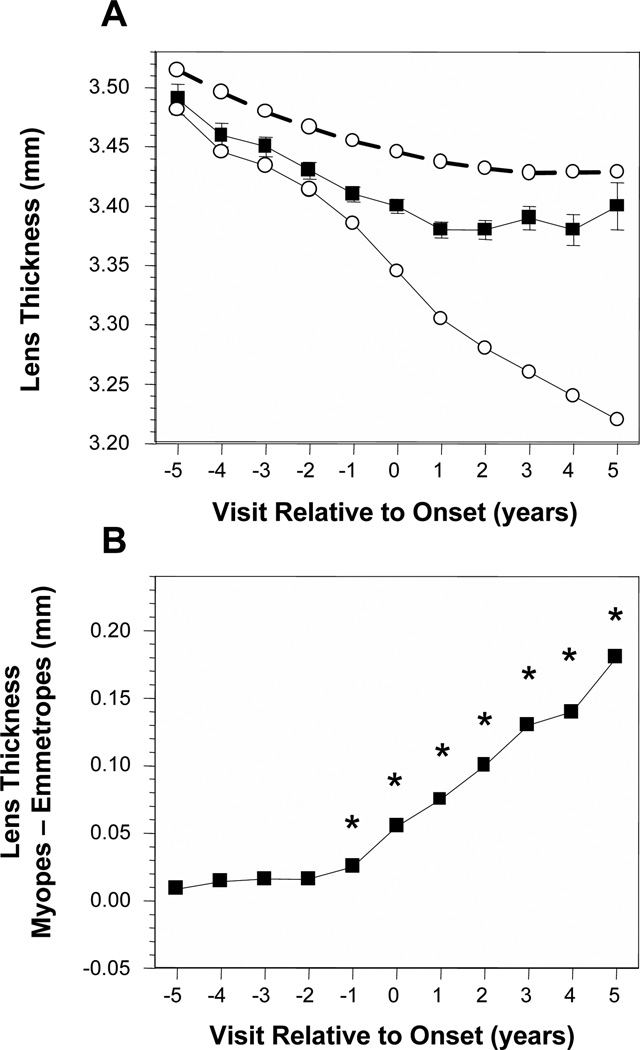
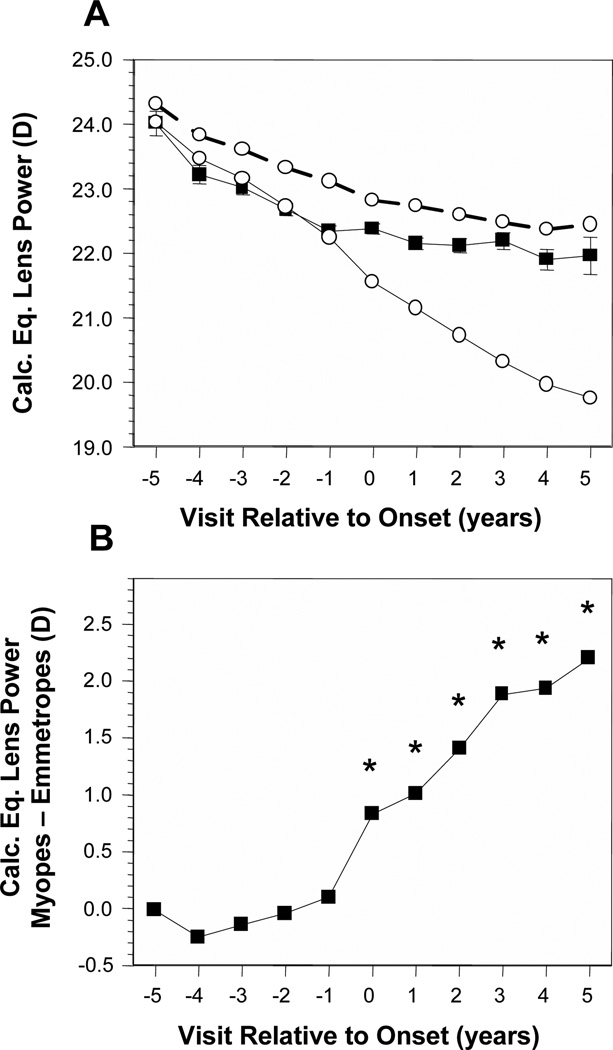
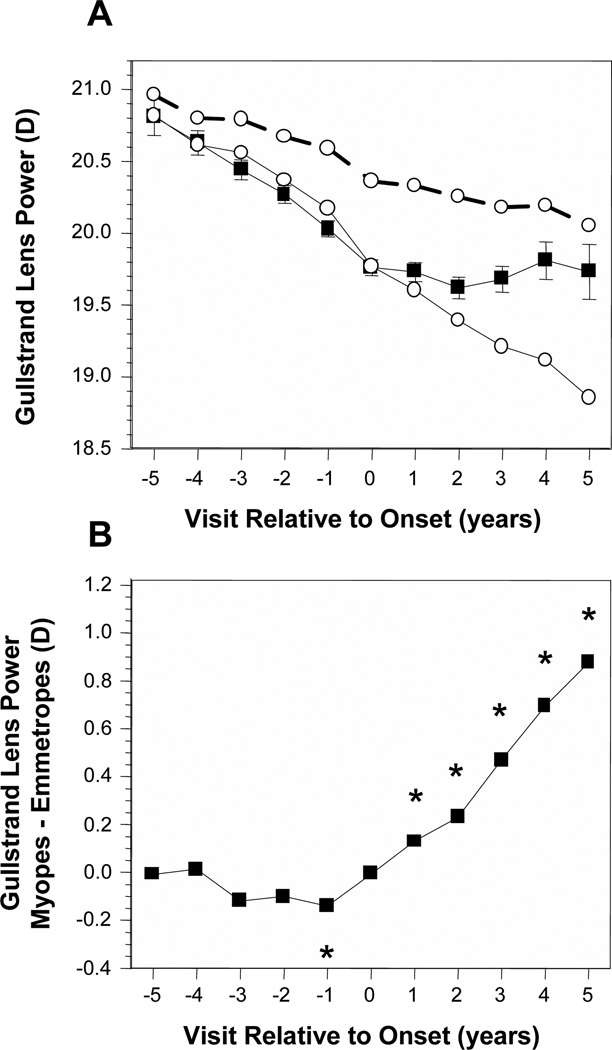
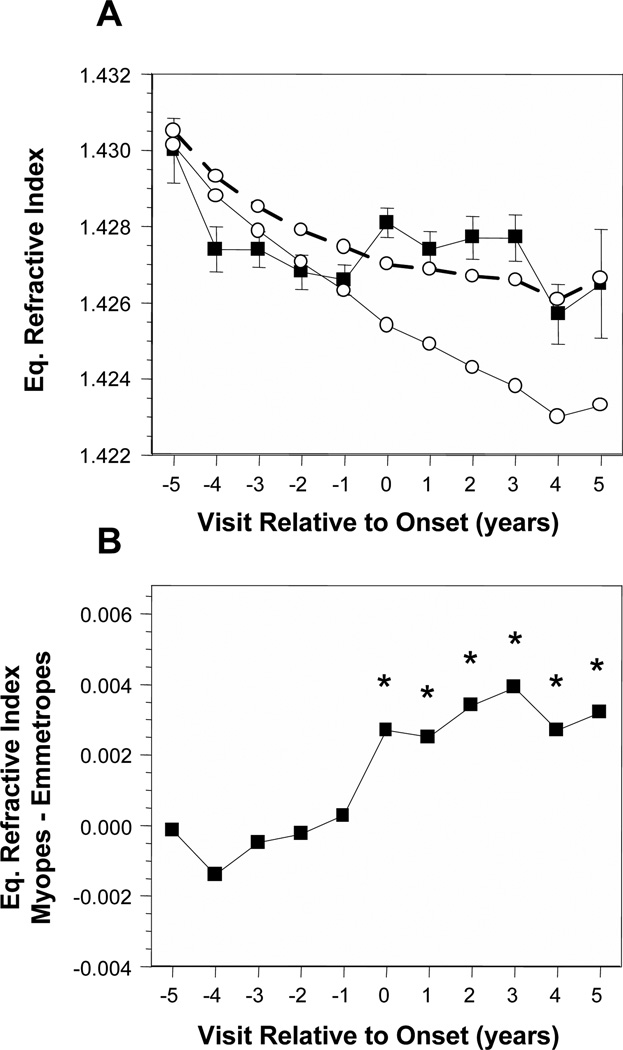
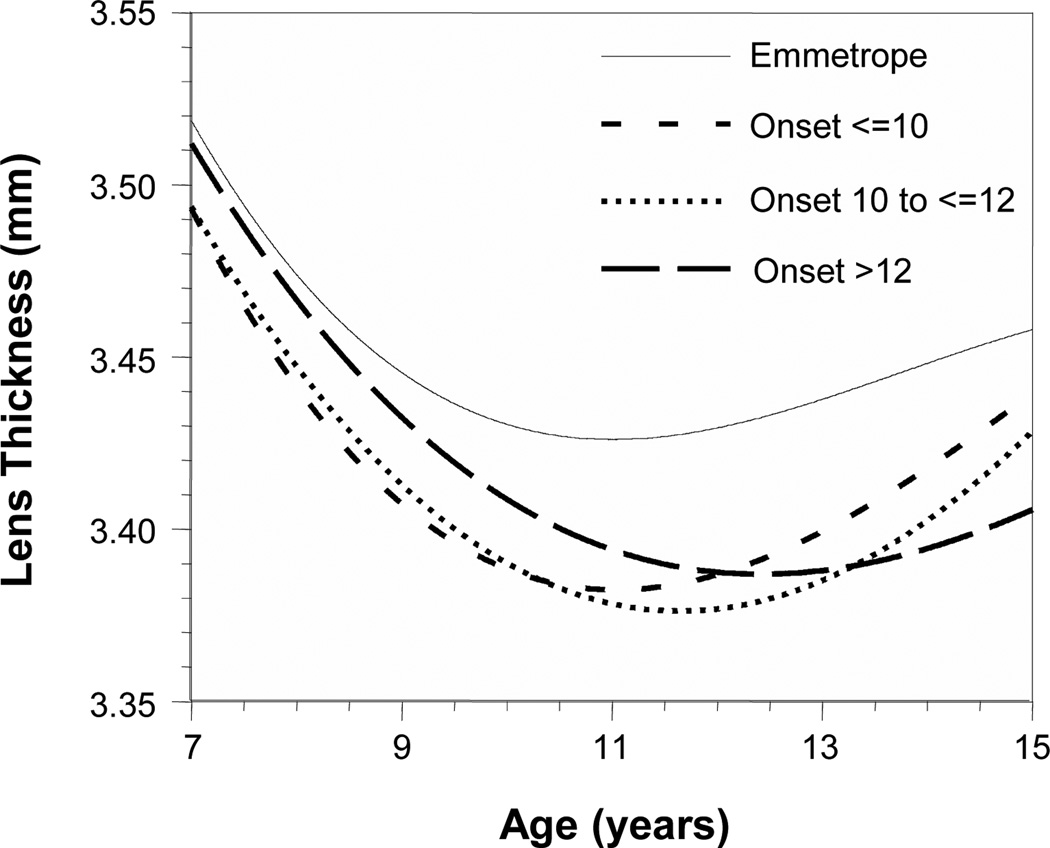
Results: Before myopia onset, the crystalline lens thinned, flattened, and lost power at similar rates for emmetropes and children who became myopic. The crystalline lens stopped thinning, flattening, and losing power within ±1 year of onset in children who became myopic compared with emmetropes statistically adjusted to match the longer VCDs of children who became myopic. In contrast, the cornea was only slightly steeper in children who became myopic compared with emmetropes (<0.25 D) and underwent little change across visits.
Conclusions: Myopia onset is characterized by an abrupt loss of compensatory changes in the crystalline lens that continue in emmetropes throughout childhood axial elongation. The mechanism responsible for this decoupling remains speculative but might include restricted equatorial growth from internal mechanical factors.
Figures
References
-
- Inagaki Y. The rapid change of corneal curvature in the neonatal period and infancy. Arch Ophthalmol. 1986;104:1026–1027. - PubMed
-
- Insler MS, Cooper HD, May SE, Donzis PB. Analysis of corneal thickness and corneal curvature in infants. CLAO J. 1987;13:182–184. - PubMed
-
- Blomdahl S. Ultrasonic measurements of the eye in the newborn infant. Acta Ophthalmol. 1979;57:1048–1056. - PubMed
-
- Mutti DO, Mitchell GL, Jones LA, Friedman NE, Frane SL, Lin WK, Moeschberger ML, Zadnik K. Axial growth and changes in lenticular and corneal power during emmetropization in infants. Invest Ophthalmol Vis Sci. 2005;46:3074–3080. - PubMed
-
- Jones LA, Mitchell GL, Mutti DO, Hayes JR, Moeschberger ML, Zadnik K. Comparison of ocular component growth curves among refractive error groups in children. Invest Ophthalmol Vis Sci. 2005;46:2317–2327. - PubMed
Publication types
MeSH terms
Grants and funding
LinkOut - more resources
Full Text Sources
