. 2012 May 1;21(9):1931-44.
doi: 10.1093/hmg/dds003. Epub 2012 Jan 6.

LRRK2 regulates mitochondrial dynamics and function through direct interaction with DLP1

Affiliations

LRRK2 regulates mitochondrial dynamics and function through direct interaction with DLP1

Xinglong Wang et al. Hum Mol Genet. .

Abstract

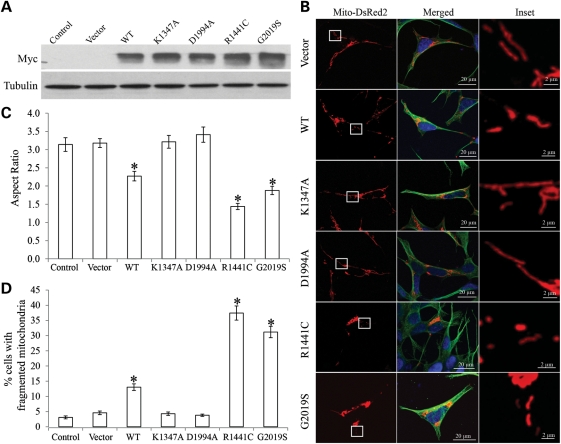
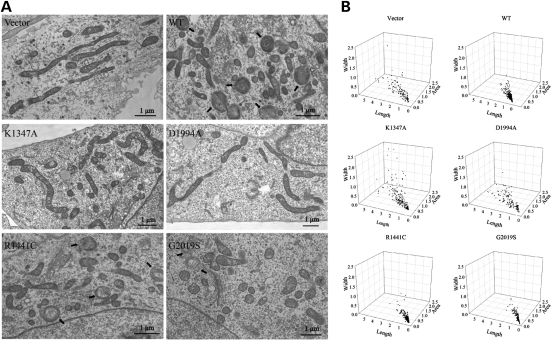
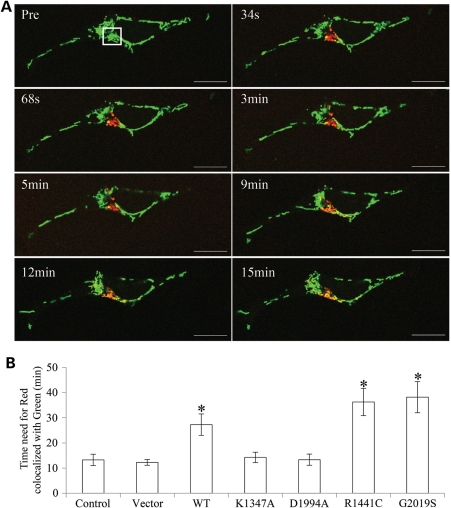
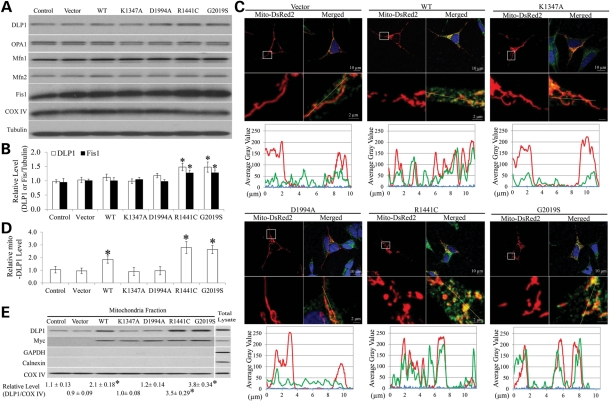
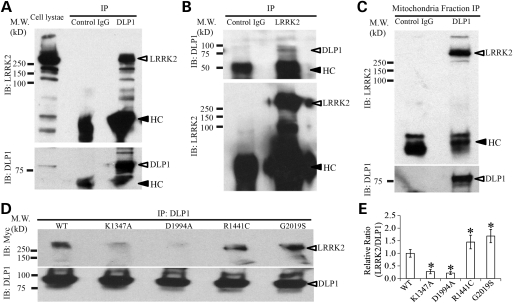
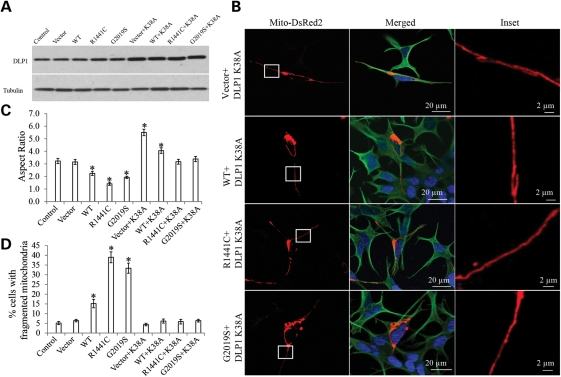
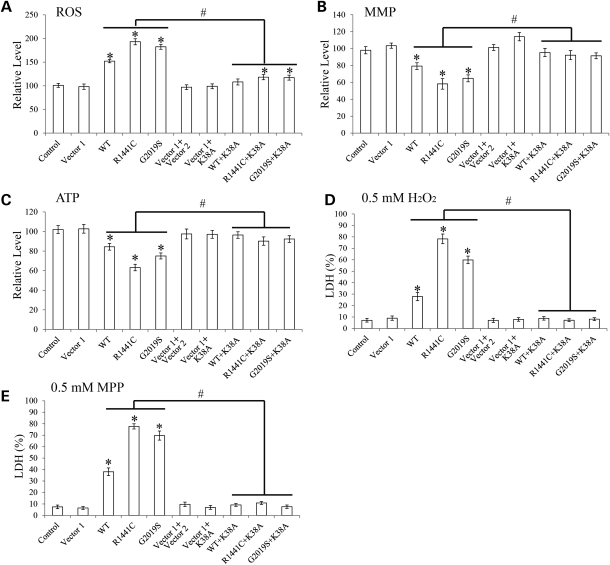
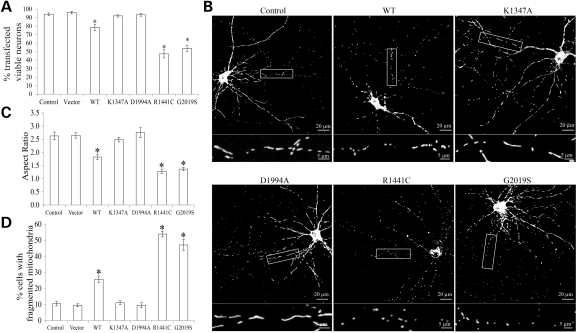
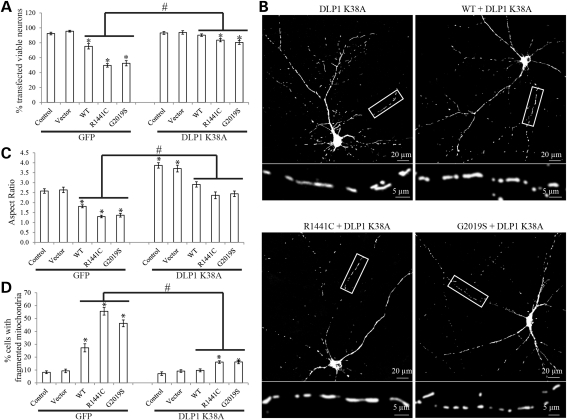
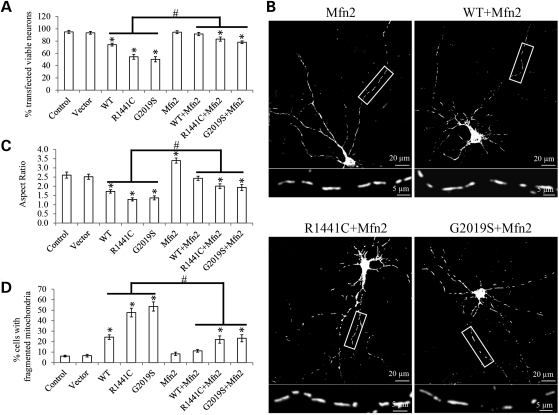
The leucine-rich repeat kinase 2 (LRRK2) mutations are the most common cause of autosomal-dominant Parkinson disease (PD). Mitochondrial dysfunction represents a critical event in the pathogenesis of PD. We demonstrated that wild-type (WT) LRRK2 expression caused mitochondrial fragmentation along with increased mitochondrial dynamin-like protein (DLP1, also known as DRP1), a fission protein, which was further exacerbated by expression of PD-associated mutants (R1441C or G2019S) in both SH-SY5Y and differentiated primary cortical neurons. We also found that LRRK2 interacted with DLP1, and LRRK2-DLP1 interaction was enhanced by PD-associated mutations that probably results in increased mitochondrial DLP1 levels. Co-expression of dominant-negative DLP1 K38A or WT Mfn2 blocked LRRK2-induced mitochondrial fragmentation, mitochondrial dysfunction and neuronal toxicity. Importantly, mitochondrial fragmentation and dysfunction were not observed in cells expressing either GTP-binding deficient mutant LRRK2 K1347A or kinase-dead mutant D1994A which has minimal interaction with DLP1 and did not increase the mitochondrial DLP1 level. We concluded that LRRK2 regulates mitochondrial dynamics by increasing mitochondrial DLP1 through its direct interaction with DLP1, and LRRK2 kinase activity plays a critical role in this process.


Figures

Figure 1.
Figure 1.
Effect of LRRK2 on mitochondrial morphology. (A) Representative immunoblot shows LRRK2 levels in human dopaminergic neuroblastoma SH-SY5Y clonal lines that stably overexpress WT or mutant LRRK2. An aliquot of 20 μg/lane was loaded and tubulin used as an internal loading control. (B) SH-SY5Y cells were transfected with mito-DsRed2 to label mitochondria, fixed 2 days after transfection, immunostained with tubulin and evaluated. Representative pictures of positively transfected cells are shown. Green, tubulin; red, mito-DsRed2; blue, DAPi. Insets show enlargements of boxed areas. (C and D) Quantification of mitochondrial morphology revealed a significant decrease in the aspect ratio (C), and increase in the percentage of cells displaying fragmented mitochondria (D) compared with controls. For each cell line, at least 500 cells were analyzed in each experiment and experiments were repeated three times (*P < 0.001, Student's t-test).
Figure 2.
Figure 2.
Electron microscopy analysis of mitochondrial morphology. (A) Representative EM micrographs of vector, LRRK2 WT, K1347A, D1994A, R1441C and G2019S cells are shown. Arrows mark mitochondria with abnormal multilamellar onion-like structures that are only found in WT, R1441C and G2019S LRRK2 cells. (B) Quantitative analysis of mitochondrial morphology (width, length and number) in these cells based on EM micrographs. At least 500 mitochondria were analyzed in each cell line.
Figure 3.
Figure 3.
LRRK2 slows mitochondrial fusion. (A) SH-SY5Y cells were transfected with mito-Dendra2 to label mitochondria. Before photo-conversion (Pre), Dendra2 emits green fluorescence. At time 0, laser activation is applied to ROI (square box) to allow full photo-conversion, from green to red, of all of the mitochondria within the ROI. Thereafter, the lateral diffusion and merger of all the photo-converted red mitochondrial fluorescence with non-activated green signals of the neighboring mitochondria was monitored for 60 min. Scale bar: 20 µm. (B) Quantitative analysis of time needed for the red signal to be completely co-localized with green signal in control, vector, LRRK2 WT, K1347A, D1994A, R1441C and G2019S cells. For each cell line, at least 10 cells were analyzed in each experiment and experiments were repeated three times (*P< 0.05, Student's t-test).
Figure 4.
Figure 4.
LRRK2 increased mitochondrial recruitment of DLP1. Representative immunoblot (A) and quantification analysis (B) of the expression levels of mitochondria fission and fusion proteins in SH-SY5Y cells demonstrated slight but significant increase in DLP1 and Fis1 in R1441C and G2019S cells compared with controls. There was no change in other mitochondria fission and fusion proteins and mitochondrial marker protein COX IV. Equal protein amounts (10 μg) were loaded and tubulin was used as an internal loading control. (C) Representative confocal pictures with line scan (yellow line) of DAPI (blue), DLP1 (green) and mitochondria (red) in SH-SY5Y cell lines demonstrated increased mitochondrial co-localization of DLP1 with mitochondria in WT, R1141C and G2019S cells but not in K1347A and D1994A cells. Boxed areas enlarged immediately below images. (D) Quantification of the immunoreactivity of DLP1 localized to mitochondria. The relative mito-DLP1 level was defined as the relative ratio (control is set as 1) between the intensity of green signal that co-localizes with red signal and the intensity of total red signal. At least 20 cells were analyzed in each experiment (*P< 0.05, when compared with the control cells; Student's t-test). (E) Representative immunoblot and quantification of the relative level of DLP1 in the mitochondria fraction from SH-SY5Y cell lines. myc-immunoreactivity (LRRK2 expression) is also noted in the mitochondrial fraction. The presence of COX IV and absence of GAPDH (cytosolic marker) and calnexin (ER marker) confirm the purity of the mitochondrial fraction preparations. All experiments were repeated three times (*P< 0.05, when compared with the control cells; Student's t-test).
Figure 5.
Figure 5.
LRRK2 interacts with DLP1. (A and B) Co-immunoprecipitation (co-IP) assay in WT LRRK2 SH-SY5Y cells. Cells were lysed by RIPA buffer and immunoprecipitated (IP) with indicated antibodies and analyzed by immunoblot (IB). Bottom panels show re-probing of upper blots. HC denotes heavy chain. (C) co-IP assay in subcellular mitochondrial fraction prepared from WT SH-SY5Y cells. Mouse mAb IgG isotope control (A and C) or rabbit mAb IgG isotope control (B) was also used as a non-specific negative control (Control IgG). (D and E) Representative co-IP assay and quantification in LRRK2 cells demonstrated significantly increased levels of LRRK2 co-precipitated with DLP1 in R1441C and G2019S cells but significantly decreased levels of LRRK2 co-IP with DLP1 in K1347A and D1994A cells comparing with WT LRRK2 cells. All experiments were repeated three times (*P< 0.05, when compared with WT cells; Student's t-test).
Figure 6.
Figure 6.
LRRK2 induced mitochondria fragmentation could be completely restored by dominant-negative DLP1. (A) Representative immunoblot confirmed the overexpression of DLP1 K38A in double-transgenic stable clonal cell lines. Equal protein amounts (10 μg) were loaded and tubulin was used as an internal loading control. (B) Representative pictures show that overexpression of DLP1 K38A mutant restores LRRK2-induced mitochondria fragmentation in double-transgenic cell lines. Green, tubulin; red, mito-DsRed2; blue, DAPi. Insets represent boxed areas. Quantification of mitochondria morphology showed a significant increase in the aspect ratio (C) and a decrease in the percentage of cells displaying fragmented mitochondria (D) in LRRK2 WT, R1441C and G2019S cells also expressing DLP1 K38A. For each cell line, at least 500 cells were analyzed in each experiment and experiments were repeated three times (*P< 0.05, when compared with the control cells; Student's t-test).
Figure 7.
Figure 7.
LRRK2-induced mitochondrial dysfunction and cell vulnerability to stress could be rescued by dominant-negative DLP1. SH-SY5Y cells were seeded on 96-well plates, and the intracellular levels of reactive oxygen species (ROS) (A), mitochondrial membrane potential (MMP) (B) and ATP (C) were measured. SH-SY5Y cells seeded on 96-well plates were treated with 0.5 mm H2O2 (D) or 0.5 mm MPP+ (E) for 24 h. Cell death was measured by LDH release assay. All experiments were repeated three times (asterisk represents P< 0.05 when compared with the control neurons and hash symbol represents P< 0.05 when compared with neurons with only LRRK2 overexpression; Student's t-test).
Figure 8.
Figure 8.
LRRK2-induced mitochondrial fragmentation in primary neurons. Rat E18 primary cortical neurons (DIV = 7) were transiently co-transfected with myc-tagged LRRK2 (WT, K1347A, D1994A, R1441C or G2019S) and mito-DsRed2 at a ratio of 9:1. Two or three days after transfection, neurons were fixed, stained and imaged by laser confocal microscopy. (A) Quantification of neuronal viability in positively transfected neurons 3 days after transfection. (B–D) Mitochondrial morphology was evaluated 2 days after transfection. Representative images (B) and quantification of mitochondria morphology (C and D) in primary neurons transfected with indicated plasmids. Boxed areas enlarged immediately below. At least 20 cells were analyzed in each experiment and experiments were repeated three times (*P< 0.001, when compared with the control neurons; Student's t-test).
Figure 9.
Figure 9.
Dominant-negative DLP1 rescued LRRK2-induced mitochondrial abnormalities in primary neurons. Rat E18 primary cortical neurons (DIV = 7) were transiently co-transfected with myc-tagged LRRK2 (WT, R1441C or G2019S), GFP/GFP-tagged DLP1 K38A and mito-DsRed2 at a ratio of 9:1:1. (A) Quantification of neuronal viability in positive transfected neurons 3 days after transfection. Mitochondrial morphology was evaluated 2 days after transfection (B–D). (B) Representative pictures show that co-overexpression of DLP1 K38A mutant prevents LRRK2-induced mitochondria fragmentation in rat E18 primary cortical neurons 2 days after transfection. The boxed area was enlarged immediately below the picture. (C and D) Quantification of mitochondria morphology in primary neurons transfected with indicated plasmids. At least 20 cells were analyzed in each experiment and experiments were repeated three times (asterisk represents P< 0.05 when compared with the control neurons and hash symbol represents P< 0.05  when compared with neurons with only LRRK2 overexpression; Student's t-test).
Figure 10.
Figure 10.
Mfn2 overexpression rescued LRRK2-induced mitochondrial abnormalities in primary neurons. Rat E18 primary cortical neurons (DIV = 7) were transiently co-transfected with myc-tagged LRRK2 (WT, R1441C or G2019S), Flag-tagged Mfn2 and mito-DsRed2 at a ratio of 9:1:1. (A) Quantification of neuronal viability in positive transfected neurons 3 days after transfection. Mitochondrial morphology was evaluated 2 days after transfection (B–D). (B) Representative pictures show that co-overexpression of Mfn2 prevents LRRK2-induced mitochondria fragmentation in rat E18 primary cortical neurons. The boxed area was enlarged immediately below the picture. (C and D) Quantification of mitochondria morphology in primary neurons transfected with indicated plasmids. At least 20 cells were analyzed in each experiment, and experiments were repeated three times (asterisk represents P< 0.05 when compared with the control neurons and hash symbol represents when compared with neurons with only LRRK2 overexpression; Student's t-test).

References

    1. Mata I.F., Wedemeyer W.J., Farrer M.J., Taylor J.P., Gallo K.A. LRRK2 in Parkinson's disease: protein domains and functional insights. Trends Neurosci. 2006;29:286–293. - PubMed
    1. Zimprich A., Biskup S., Leitner P., Lichtner P., Farrer M., Lincoln S., Kachergus J., Hulihan M., Uitti R.J., Calne D.B., et al. Mutations in LRRK2 cause autosomal-dominant parkinsonism with pleomorphic pathology. Neuron. 2004;44:601–607. - PubMed
    1. Paisan-Ruiz C., Jain S., Evans E.W., Gilks W.P., Simon J., van der Brug M., Lopez de Munain A., Aparicio S., Gil A.M., Khan N., et al. Cloning of the gene containing mutations that cause PARK8-linked Parkinson's disease. Neuron. 2004;44:595–600. - PubMed
    1. Lesage S., Brice A. Parkinson's disease: from monogenic forms to genetic susceptibility factors. Hum. Mol. Genet. 2009;18:R48–R59. - PubMed
    1. Henchcliffe C., Beal M.F. Mitochondrial biology and oxidative stress in Parkinson disease pathogenesis. Nat. Clin. Pract. Neurol. 2008;4:600–609. - PubMed

Publication types

MeSH terms