

Admixture mapping identifies a locus on 6q25 associated with breast cancer risk in US Latinas
- PMID: 22228098
- PMCID: PMC3313799
- DOI: 10.1093/hmg/ddr617
Admixture mapping identifies a locus on 6q25 associated with breast cancer risk in US Latinas
Abstract
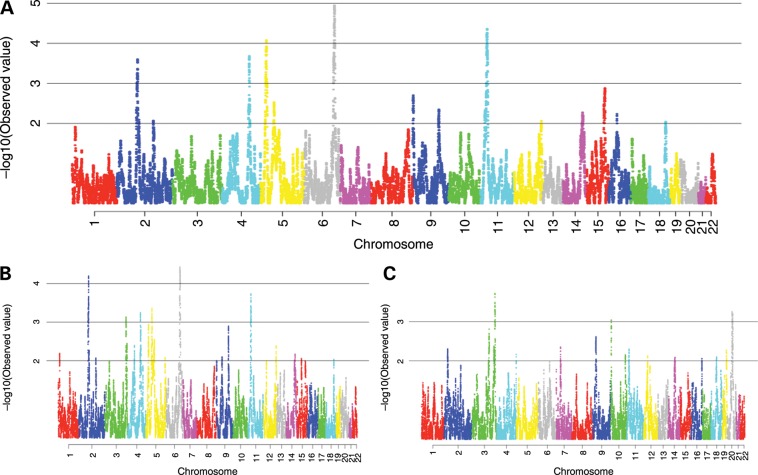
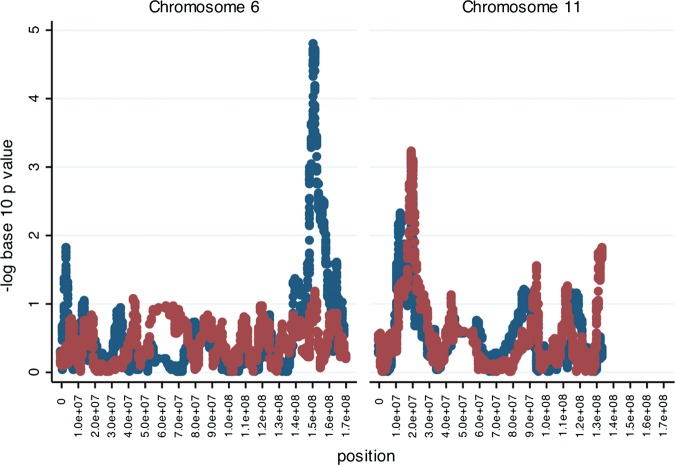
Among US Latinas and Mexican women, those with higher European ancestry have increased risk of breast cancer. We combined an admixture mapping and genome-wide association mapping approach to search for genomic regions that may explain this observation. Latina women with breast cancer (n= 1497) and Latina controls (n= 1272) were genotyped using Affymetrix and Illumina arrays. We inferred locus-specific genetic ancestry and compared the ancestry between cases and controls. We also performed single nucleotide polymorphism (SNP) association analyses in regions of interest. Correction for multiple-hypothesis testing was conducted using permutations (P(corrected)). We identified one region where genetic ancestry was significantly associated with breast cancer risk: 6q25 [odds ratio (OR) per Indigenous American chromosome 0.75, 95% confidence interval (CI): 0.65-0.85, P= 1.1 × 10(-5), P(corrected)= 0.02]. A second region on 11p15 showed a trend towards association (OR per Indigenous American chromosome 0.77, 95% CI: 0.68-0.87, P= 4.3 × 10(-5), P(corrected)= 0.08). In both regions, breast cancer risk decreased with higher Indigenous American ancestry in concordance with observations made on global ancestry. The peak of the 6q25 signal includes the estrogen receptor 1 (ESR1) gene and 5' region, a locus previously implicated in breast cancer. Genome-wide association analysis found that a multi-SNP model explained the admixture signal in both regions. Our results confirm that the association between genetic ancestry and breast cancer risk in US Latinas is partly due to genetic differences between populations of European and Indigenous Americans origin. Fine-mapping within the 6q25 and possibly the 11p15 loci will lead to the discovery of the biologically functional variant/s behind this association.
Figures

References
-
- Jemal A., Siegel R., Xu J., Ward E. Cancer statistics, 2010. CA Cancer J. Clin. 2010;60:277–300. - PubMed
-
- Nalls M.A., Wilson J.G., Patterson N.J., Tandon A., Zmuda J.M., Huntsman S., Garcia M., Hu D., Li R., Beamer B.A., et al. Admixture mapping of white cell count: genetic locus responsible for lower white blood cell count in the Health ABC and Jackson Heart studies. Am. J. Hum. Genet. 2008;82:81–87. - PMC - PubMed
Publication types
MeSH terms
Substances
Grants and funding
- CA160607/CA/NCI NIH HHS/United States
- AI077439/AI/NIAID NIH HHS/United States
- U01 CA69417/CA/NCI NIH HHS/United States
- R25 CA112355/CA/NCI NIH HHS/United States
- R01 HG006399/HG/NHGRI NIH HHS/United States
- R01 HL078885/HL/NHLBI NIH HHS/United States
- R37 CA54281/CA/NCI NIH HHS/United States
- HL078885/HL/NHLBI NIH HHS/United States
- R01 CA063464/CA/NCI NIH HHS/United States
- R01 CA132839/CA/NCI NIH HHS/United States
- R01-CA77305/CA/NCI NIH HHS/United States
- R01 CA63464/CA/NCI NIH HHS/United States
- K12 HD052163/HD/NICHD NIH HHS/United States
- HL088133/HL/NHLBI NIH HHS/United States
- K01 CA160607/CA/NCI NIH HHS/United States
- U01 CA069417/CA/NCI NIH HHS/United States
- R01 ES015794/ES/NIEHS NIH HHS/United States
- 5K12HD052163/HD/NICHD NIH HHS/United States
- U19 AI077439/AI/NIAID NIH HHS/United States
- R01-63446/PHS HHS/United States
- R01 HL088133/HL/NHLBI NIH HHS/United States
- U01 CA078296/CA/NCI NIH HHS/United States
- R37 CA054281/CA/NCI NIH HHS/United States
- R01 CA120120/CA/NCI NIH HHS/United States
- K24 CA169004/CA/NCI NIH HHS/United States
LinkOut - more resources
Full Text Sources
Medical
Molecular Biology Databases
Miscellaneous
