Expression profiling after induction of demethylation in MCF-7 breast cancer cells identifies involvement of TNF-α mediated cancer pathways
- PMID: 22228181
- PMCID: PMC3887717
- DOI: 10.1007/s10059-012-2182-8
Expression profiling after induction of demethylation in MCF-7 breast cancer cells identifies involvement of TNF-α mediated cancer pathways
Abstract
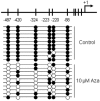
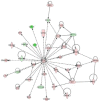
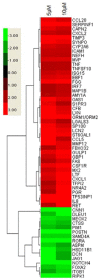
Epigenetic methylation change is a major process that occurs during cancer development. Even though many tumor-related genes have been identified based on their relationship between methylation and expression, few studies have been conducted to investigate the relevant biological pathways involved in these changes. To identify essential pathways likely to be affected by methylation in breast cancer, we examined a pool of genes in which expression was upregulated after induction of demethylation by 5-Aza-2'-deoxycytidine (Aza) in the MCF-7 breast cancer cell line. Genome-wide demethylation was confirmed by monitoring the demethylation of a previously known gene, SULT1A1. Overall, 210 and 213 genes were found to be upregulated and downregulated (fold change ≥ 2), respectively, in common in cells treated with 5 and 10 μM of Aza. Network analysis of these 423 genes with altered expression patterns identified the involvement of a cancer related network of genes that were heavily regulated by TNF-α in breast tumorigenesis. Our results suggest that epigenetic dysregulation of cellular processes relevant to TNF-α-dependent apoptosis may be intimately involved in tumorigenesis in MCF-7 cells.
Figures


Similar articles
-
Genome-wide methylation analysis identifies involvement of TNF-α mediated cancer pathways in prostate cancer.Cancer Lett. 2011 Mar 1;302(1):47-53. doi: 10.1016/j.canlet.2010.12.010. Epub 2011 Jan 14. Cancer Lett. 2011. PMID: 21237555
-
Differential methylation hybridization profiling identifies involvement of STAT1-mediated pathways in breast cancer.Int J Oncol. 2011 Oct;39(4):955-63. doi: 10.3892/ijo.2011.1075. Epub 2011 Jun 14. Int J Oncol. 2011. PMID: 21674123
-
Global identification of genes regulated by estrogen signaling and demethylation in MCF-7 breast cancer cells.Biochem Biophys Res Commun. 2012 Sep 14;426(1):26-32. doi: 10.1016/j.bbrc.2012.08.007. Epub 2012 Aug 10. Biochem Biophys Res Commun. 2012. PMID: 22902638
-
DNA methylation-dependent epigenetic regulation of gene expression in MCF-7 breast cancer cells.Epigenetics. 2006 Jan-Mar;1(1):32-44. doi: 10.4161/epi.1.1.2358. Epub 2005 Nov 18. Epigenetics. 2006. PMID: 17998816
-
Hypothesis: Activation of rapid signaling by environmental estrogens and epigenetic reprogramming in breast cancer.Reprod Toxicol. 2015 Jul;54:136-40. doi: 10.1016/j.reprotox.2014.12.014. Epub 2014 Dec 29. Reprod Toxicol. 2015. PMID: 25554384 Free PMC article. Review.
Cited by
-
Transcriptome analysis of human colorectal cancer biopsies reveals extensive expression correlations among genes related to cell proliferation, lipid metabolism, immune response and collagen catabolism.Oncotarget. 2017 Aug 18;8(43):74703-74719. doi: 10.18632/oncotarget.20345. eCollection 2017 Sep 26. Oncotarget. 2017. PMID: 29088818 Free PMC article.
-
A pathway-based classification of breast cancer integrating data on differentially expressed genes, copy number variations and microRNA target genes.Mol Cells. 2012 Oct;34(4):393-8. doi: 10.1007/s10059-012-0177-0. Epub 2012 Sep 13. Mol Cells. 2012. PMID: 22983731 Free PMC article.
-
ELOVL2-AS1 suppresses tamoxifen resistance by sponging miR-1233-3p in breast cancer.Epigenetics. 2023 Dec;18(1):2276384. doi: 10.1080/15592294.2023.2276384. Epub 2023 Oct 31. Epigenetics. 2023. PMID: 37908128 Free PMC article.
-
Pathway landscapes and epigenetic regulation in breast cancer and melanoma cell lines.Theor Biol Med Model. 2014 May 7;11 Suppl 1(Suppl 1):S8. doi: 10.1186/1742-4682-11-S1-S8. Epub 2014 May 7. Theor Biol Med Model. 2014. PMID: 25077705 Free PMC article.
-
Epigenetic activation of the prostaglandin receptor EP4 promotes resistance to endocrine therapy for breast cancer.Oncogene. 2017 Apr 20;36(16):2319-2327. doi: 10.1038/onc.2016.397. Epub 2016 Nov 21. Oncogene. 2017. PMID: 27869171 Free PMC article.
References
-
- Ando K., Kanazawa S., Tetsuka T., Ohta S., Jiang X., Tada T., Kobayashi M., Matsui N., Okamoto T. Induction of Notch signaling by tumor necrosis factor in rheumatoid synovial fibroblasts. Oncogene. 2003;22:7796–7803. - PubMed
-
- Bonazzi V.F., Irwin D., Hayward N.K. Identification of candidate tumor suppressor genes inactivated by promoter methylation in melanoma. Genes Chromosomes Cancer. 2009;48:10–21. - PubMed
-
- Budinsky A.C., Brodowicz T., Wiltschke C., Czerwenka K., Michl I., Krainer M., Zielinski C.C. Decreased expression of ICAM-1 and its induction by tumor necrosis factor on breast-cancer cells in vitro. Int. J. Cancer. 1997;71:1086–1090. - PubMed
-
- Calvano S.E., Xiao W., Richards D.R., Felciano R.M., Baker H.V., Cho R.J., Chen R.O., Brownstein B.H., Cobb J.P., Tschoeke S.K., et al. A network-based analysis of systemic inflammation in humans. Nature. 2005;437:1032–1037. - PubMed
Publication types
MeSH terms
Substances
LinkOut - more resources
Full Text Sources
Medical

