. 2012 Jan 17;109(3):739-44.
doi: 10.1073/pnas.1007809109. Epub 2012 Jan 6.

Collective and single cell behavior in epithelial contact inhibition

Affiliations

Collective and single cell behavior in epithelial contact inhibition

Alberto Puliafito et al. Proc Natl Acad Sci U S A. .

Abstract

Control of cell proliferation is a fundamental aspect of tissue physiology central to morphogenesis, wound healing, and cancer. Although many of the molecular genetic factors are now known, the system level regulation of growth is still poorly understood. A simple form of inhibition of cell proliferation is encountered in vitro in normally differentiating epithelial cell cultures and is known as "contact inhibition." The study presented here provides a quantitative characterization of contact inhibition dynamics on tissue-wide and single cell levels. Using long-term tracking of cultured Madin-Darby canine kidney cells we demonstrate that inhibition of cell division in a confluent monolayer follows inhibition of cell motility and sets in when mechanical constraint on local expansion causes divisions to reduce cell area. We quantify cell motility and cell cycle statistics in the low density confluent regime and their change across the transition to epithelial morphology which occurs with increasing cell density. We then study the dynamics of cell area distribution arising through reductive division, determine the average mitotic rate as a function of cell size, and demonstrate that complete arrest of mitosis occurs when cell area falls below a critical value. We also present a simple computational model of growth mechanics which captures all aspects of the observed behavior. Our measurements and analysis show that contact inhibition is a consequence of mechanical interaction and constraint rather than interfacial contact alone, and define quantitative phenotypes that can guide future studies of molecular mechanisms underlying contact inhibition.


Conflict of interest statement

The authors declare no conflict of interest.

Figures

Fig. 1.
Fig. 1.
Epithelial colony growth. (A) Superimposed snapshots of a single colony at different times, coded by different shades of gray. Time-points were chosen to keep area increment constant. Black contours correspond to 3.0, 4.8, 5.5, 5.9, 6.3 days after seeding. (B) Total area of the spreading colony. Time is counted relative to the “morphological transition” at t = 0 (see text). Green points represent total cell number (independently measured) multiplied by the average cell area. The blue line is exponential growth with the average cell cycle time τ2 = 0.75 ± 0.14 (s.e.m.) days (measured independently by single cell tracking). (C) Cell density in the inner region of the colony (different colors distinguish different fields of view). The solid black line at constant density and is a guide for the eye. The dashed black line represents exponential growth of density expected for continued cell proliferation without cell motion.
Fig. 2.
Fig. 2.
Correlation analysis of cell motility. (A)–(B) Phase images of a confluent layer (1 h before and 27 h after the morphological transition) with overlaid instantaneous velocity field (measured by PIV and interpolated) side by side with cell trajectories integrated over 200 min with blue and red labeling respectively the beginning and the end. Scale bar is 100 μm. (C)–(D) R.m.s. velocity of cell motion (red symbols) and the correlation length (blue symbols) across the morphological transition in a in the bulk of the expanding colony (C) and in the continuous confluent layer plated at higher initial density (D). Data pooled from four different 450 × 336 μm2 fields of view. Lines are to guide the eye. (D) Inset: Correlation time of cell trajectories.
Fig. 3.
Fig. 3.
Large-scale quantitative characterization of contact inhibition. (A)–(B) Image segmentation for MDCK cell cultures grown on PDMS. (A) phase-contrast image of Ecad-GFP MDCK at low cell density. (B) fluorescent image of Ecad-GFP MDCK at high cell density. Scale bar: 100 μm. (C) Median of cell area distribution (over a 450 × 336 μm2 field of view) as a function of time (t = 0 set to the morphological transition). Here MDCK cells were seeded at uniform density (see Methods) and imaging commenced upon confluency. Different line colors represent different experiments which are time aligned. No density change is detectable after 15–18 d. (D) Radial distribution function of cells at different times across the morphological transition. g(R) is the ratio between the density of cells in a circular annulus distance R from a reference cell and the average density. The appearance of a peak (and a trough) in the static posttransitional phase represents increased short range ordering of cells. t = 0 is defined by the first appearance of the peak: max(g(R)) > 1.2.
Fig. 4.
Fig. 4.
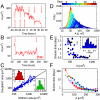
Single cell level quantification of contact inhibition. (A) and (B) Traces of single cell area tracked as a function of time. Arrows represent mitosis. (A) starts below confluence and reaches high density confluence; (B) is in the posttransition phase. Dashed lines represent temporal averages. (C) Daughter cell area versus the area of the mother cell. Data represent 96 divisions at different times for confluent layers. Daughter cell area as the average over three time points 1 h apart, 12 h after mitosis. Mother vs daughter cell areas follow the line y = x/2, plotted in black. (C) Upper inset: Distribution of daughter cell areas in % of the mother cell area. (C) Lower inset: Deviation of the total daughter cell area from the mother cell area. (D) Distribution of cell area in the posttransition regime. Color codes for time. Each distribution represents the population of (at least 200) cells in the same 336 × 450 μm2 field of view. Cell area is measured by means of computer segmentation of MDCK-Ecad-GFP fluorescent images (see Fig. 3A). E) Single cell division times as a function of premitotic area. Different colors represent different experiments. We note that cell cycle time increases dramatically for cell areas below 200 μm2. The absence of data below 70 μm2 is due to the difficulty of tracking single cells in that regime. E) inset: Distribution of division times in the pretransition regime. F) Division times as a function of cell area inferred from the dynamics of the P(A) functions using Eq. 1 (see Methods). Different colors represent different experiments. The black line represents average division time in the pretransition regime. Cell division slows down for cell size below 200 μm2, consistent with cell tracking measurements shown in E.
Fig. 5.
Fig. 5.
Simulation results. (A) Sketch of the one-dimensional tissue growth model. Green springs represent cell elasticity, cell boundaries are marked in gray and cell attachments are represented as black tethers. (B) Spatio-temporal profile of proliferation rate (indicated by the color) in the colony. Initially, proliferation is uniform and the colony size increases exponentially (dashed line) with time. At later times, proliferation in the bulk slows down and stops; in fixed size marginal zones rapid cell proliferation continues leading to a linear increase of the colony size (dotted line). (C) Cell size distribution as a function of time (coded by color). The initial distribution around l0 (set by the ratio of the rates of cell growth and proliferation) becomes broader and converges with time to a stationary distribution with mean below lmin. Inset shows the coefficient of variation. (D) Traction force distribution throughout the colony at different times (coded by color). Note that small colonies are under tension. At later times only the margins of the colony are under tension, while the center is stress free.

Comment in

Similar articles

Cited by

References

    1. Leevers SJ, McNeill H. Controlling the size of organs and organisms. Curr Opin Cell Biol. 2005;17:604–609. - PubMed
    1. Lecuit T, Le Goff L. Orchestrating size and shape during morphogenesis. Nature. 2007;450:189–192. - PubMed
    1. Alberts B, et al. Molecular Biology of the Cell. New York: Garland; 2008.
    1. Chaffer CL, Thompson EW, Williams ED. Mesenchymal to epithelial transition in development and disease. Cells Tissues Organs. 2007;185:7–19. - PubMed
    1. Guarino M, Micheli P, Pallotti F, Giordano F. Pathological relevance of epithelial and mesenchymal phenotype plasticity. Pathol Res Pract. 1999;195:379–89. - PubMed

Publication types

LinkOut - more resources