. 2012 Feb;61(2):492-504.
doi: 10.2337/db11-0315. Epub 2012 Jan 6.

Activation of endoplasmic reticulum stress by hyperglycemia is essential for Müller cell-derived inflammatory cytokine production in diabetes

Affiliations

Activation of endoplasmic reticulum stress by hyperglycemia is essential for Müller cell-derived inflammatory cytokine production in diabetes

Yimin Zhong et al. Diabetes. 2012 Feb.

Abstract

Inflammation plays an important role in diabetes-induced retinal vascular leakage. The purpose of this study is to examine the role of endoplasmic reticulum (ER) stress and the signaling pathway of ER stress-induced activating transcription factor 4 (ATF4) in the regulation of Müller cell-derived inflammatory mediators in diabetic retinopathy. In diabetic animals, elevated ER stress markers, ATF4, and vascular endothelial growth factor (VEGF) expression were partially localized to Müller cells in the retina. In cultured Müller cells, high glucose induced a time-dependent increase of ER stress, ATF4 expression, and inflammatory factor production. Inducing ER stress or overexpressing ATF4 resulted in elevated intracellular adhesion molecule 1 and VEGF proteins in Müller cells. In contrast, alleviation of ER stress or blockade of ATF4 activity attenuated inflammatory gene expression induced by high glucose or hypoxia. Furthermore, we found that ATF4 regulated the c-Jun NH2-terminal kinase pathway resulting in VEGF upregulation. ATF4 was also required for ER stress-induced and hypoxia-inducible factor-1α activation. Finally, we showed that administration of chemical chaperone 4-phenylbutyrate or genetic inhibition of ATF4 successfully attenuated retinal VEGF expression and reduced vascular leakage in mice with STZ-induced diabetes. Taken together, our data indicate that ER stress and ATF4 play a critical role in retinal inflammatory signaling and Müller cell-derived inflammatory cytokine production in diabetes.


Figures
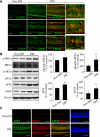
FIG. 1.
FIG. 1.
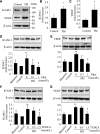
Activation of ER stress and upregulation of ATF4 colocalized with VEGF in retinal Müller cells in diabetic mice. Diabetes (DM) was induced in 8-week-old C57 mice by five consecutive STZ injections (50 mg/kg/day). ER stress markers in the retina were examined at 4 weeks after STZ injection. A: Immunohistochemistry showing increased p–eIF2-α/ATF4/CHOP (green) partially colocalized with Müller cell marker GS (red) in diabetic retinas. Scale bar = 50 μm. B: Western blot analysis showing increased phosphorylation of IRE1-α and eIF2-α and elevated ATF4 and VEGF expression in diabetic retina. Bar graphs represent quantification results using densitometry (mean ± SD, n = 4). *P < 0.05, **P < 0.01 vs. control. C: Double staining of ATF4 (green) and VEGF (red) in retinal sections from diabetic and control mice. Scale bar = 50 μm. (A high-quality digital representation of this figure is available in the online issue.)
FIG. 2.
FIG. 2.
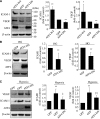
Increased expression of ER stress markers by HG in rMC-1 cells. rMC-1 cells were treated with HG (25 mmol/L) or same concentration of mannitol for 2, 4, 8, or 24 h. ER stress markers were determined by Western blot analysis. A: Representative blots from three independent experiments. Expression of GRP78 (B), p–IRE1-α (C), and p–eIF2-α (D) were quantified by densitometry (mean ± SD, n = 3). *P < 0.05, **P < 0.01 vs. control. E and F: rMC-1 cells were treated with HG with or without chemical chaperone PBA for 72 h. Expression of ATF4 (E) and CHOP (F) were determined by Western blot analysis and quantified by densitometry (mean ± SD, n = 3). **P < 0.01 vs. control. ‡P < 0.05 vs. HG.
FIG. 3.
FIG. 3.
ER stress is implicated in HG-induced ICAM-1 and VEGF expression in rMC-1 cells. AC: rMC-1 cells were treated with 0.5 μg/mL TM for 24 h. Expression of ICAM-1 and VEGF were determined with Western blot analysis and quantified by densitometry (mean ± SD, n = 3). *P < 0.05 vs. control. DG: rMC-1 cells were treated with HG with or without chemical chaperone PBA (D and E) or TUDCA (F and G) for 72 h. Expression of ICAM-1 (D and F) and VEGF (E and G) were determined by Western blot analysis (mean ± SD, n = 3). **P < 0.01 vs. control. ‡P < 0.05 vs. HG.
FIG. 4.
FIG. 4.
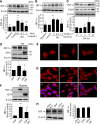
ATF4 mediates HG- and hypoxia-induced ICAM-1 and VEGF upregulation in rMC-1 cells. A: rMC-1 cells were transfected with Ad-GFP, Ad-ATF4WT, or Ad-ATF4DN for 24 h. Expression of ICAM-1 and VEGF was determined by Western blot analysis and quantified by densitometry. B and C: rMC-1 cells were infected with Ad-GFP or Ad-ATF4DN for 24 h. After infection, cells were incubated with HG medium for 72 h (B) or exposed to hypoxia for 16 h (C). Expression of ICAM-1 and VEGF was measured by Western blot analysis and quantified by densitometry. Results are expressed as mean ± SD (n = 3). *P < 0.05, **P < 0.01 vs. Ad-GFP. ‡P < 0.05, ‡‡P < 0.01 vs. Ad-GFP plus hypoxia.
FIG. 5.
FIG. 5.
ER stress and ATF4 are required for HG- or hypoxia-induced HIF-1α accumulation in rMC-1 cells. A and B: rMC-1 cells were treated with HG with or without chemical chaperone PBA or TUDCA for 72 h. Mannitol was used for osmotic control. Protein level of HIF-1α was measured by Western blot analysis and quantified by densitometry. **P < 0.01 vs. control. ‡P < 0.05, ‡‡P < 0.01 vs. HG. C: rMC-1 cells were treated with 0.5 μg/mL TM for 2, 4, 8, or 24 h. Protein level of HIF-1α and VEGF was determined by Western blot analysis and quantified by densitometry. *P < 0.05 vs. control. D and E: rMC-1 cells were transfected with Ad-ATF4DN or Ad-GFP for 24 h followed by treatment with 0.5 μg/mL TM for 8 h. Expression of HIF-1α (D) was determined by Western blot analysis and quantified by densitometry. *P < 0.05 vs. GFP, ‡P < 0.05 vs. GFP+TM. Cellular distribution of HIF-1α (E) was examined by immunocytochemistry. a, Ad-GFP; b, Ad-GFP+TM; c, Ad-ATF4DN+TM. F and G: After infection with Ad-ATF4DN or Ad-GFP, rMC-1 cells were exposed to hypoxia for 2 h. Expression of HIF-1α (F) was determined by Western blot analysis and quantified by densitometry. **P < 0.01 vs. GFP, ††P < 0.01 vs. GFP+hypoxia. Immunostaining of HIF-1α (G) showing hypoxia-induced nuclear translocation of HIF-1α in Ad-GFP–treated cells but not in Ad-ATF4DN–treated cells. a–c, HIF-1α staining; d–f, merged images of HIF-1α (red) and nuclear staining with DAPI (blue). a and d, Ad-GFP; b and c, Ad-GFP plus hypoxia; c and f, Ad-ATF4DN plus hypoxia. H: rMC-1 cells were infected with Ad-ATF4WT, Ad-ATF4DN, or Ad-GFP for 24 h. Expression of HIF-1α was determined by Western blot analysis and quantified by densitometry (mean ± SD, n = 3). (A high-quality digital representation of this figure is available in the online issue.)
FIG. 6.
FIG. 6.
Activation of JNK by ER stress and ATF4 contributes to HG-induced VEGF expression in rMC-1 cells. rMC-1 cells were treated with HG with or without chemical chaperone PBA (A) or TUDCA (B) for 72 h. Mannitol was used for osmotic control. C: rMC-1 cells were treated with 0.5 μg/mL TM for 2, 4, 8, or 24 h. Phosphorylation of JNK1 was determined by Western blot analysis and quantified by densitometry. D: rMC-1 cells were preincubated with 1 or 10 μmol/L SP600125 (SP) for 1 h, followed by treatment with 0.5 μg/mL TM for 24 h. E: rMC-1 cells were preincubated with 0.1 or 1 μmol/L SP for 1 h, followed by transfection with Ad-ATF4WT for 24 h. Expression of VEGF and JNK was determined by Western blot analysis. Protein level of VEGF was quantified by densitometry. Values are expressed as mean ± SD (n = 3). **P < 0.01 vs. control; ‡P < 0.05 vs. HG; †P < 0.05 vs. TM; ♠♠P < 0.01 vs. Ad-ATF4. F: rMC-1 cells were transfected with Ad-ATF4DN or Ad-GFP for 24 h and exposed to HG for 72 h. JNK activation was evaluated by Western blot analysis. Results represent three independent experiments.
FIG. 7.
FIG. 7.
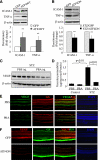
Inhibition of ATF4 or suppression of ER stress ameliorates inflammatory gene expression and reduces vascular leakage in STZ-induced diabetic mice. A: Adult C57BL/6 J mice were given intravitreal injection of Ad-GFP or Ad-ATFWT (1 × 10⁹ viral particles per eye). Two weeks after adenoviral injection, retinas were dissected and expression of proinflammatory factors (TNF-α and ICAM-1) was determined by Western blot analysis and quantified by densitometry (mean ± SD, n = 8). **P < 0.01. B: Four-week-old diabetic mice were randomly selected to receive an intravitreal injection of Ad-GFP or Ad-ATF4DN (1 × 10⁹ viral particles per eye). Two weeks after injection, retinal levels of VEGF and ICAM-1 were evaluated by Western blot analysis (mean ± SD, n = 3). C and D: After onset of diabetes, STZ-induced diabetic mice received periocular injections of PBA (0.4 μmol/eye) into one eye and the same amount of vehicle into the contralateral eye twice a week for 6 weeks. Expression of VEGF in the retina (C) was measured by Western blot analysis and quantified by densitometry (mean ± SD, n = 4). Retinal vascular permeability (D) was measured by Evans blue albumin method. Results were expressed as microgram per milligram total retinal protein (mean ± SD, n = 6). Immunostaining of VEGF and GS in retinal sections from diabetic mice after PBA treatment (E) or Ad-ATF4DN treatment (F) as described above. Images represent four animals in each group. PBS, phosphate-buffered saline. (A high-quality digital representation of this figure is available in the online issue.)
FIG. 8.
FIG. 8.
Schematic diagram showing the mechanisms of ER stress regulating inflammatory gene expression in retinal Müller cells. Diabetic insults such as hyperglycemia and hypoxia induce ER stress in retinal cells, including Müller cells. Unrelieved ER stress upregulates ATF4, which directly binds to promoters of inflammatory genes (e.g., VEGF), interacts and stabilizes HIF-1α, and activates JNK, resulting in exaggerated and sustained expression of inflammatory genes. Increased inflammatory cytokines promote leukostasis and endothelial activation, leading to breakdown of the blood-retinal barrier, vascular leakage, and diabetic macular edema.

Similar articles

Cited by

References

    1. Joussen AM, Poulaki V, Le ML, et al. A central role for inflammation in the pathogenesis of diabetic retinopathy. FASEB J 2004;18:1450–1452 - PubMed
    1. Kern TS. Contributions of inflammatory processes to the development of the early stages of diabetic retinopathy. Exp Diabetes Res 2007;2007:95103. - PMC - PubMed
    1. Li J, Wang JJ, Chen D, et al. Systemic administration of HMG-CoA reductase inhibitor protects the blood-retinal barrier and ameliorates retinal inflammation in type 2 diabetes. Exp Eye Res 2009;89:71–78 - PMC - PubMed
    1. Zhang SX, Wang JJ, Gao G, Shao C, Mott R, Ma JX. Pigment epithelium-derived factor (PEDF) is an endogenous antiinflammatory factor. FASEB J 2006;20:323–325 - PubMed
    1. Mizutani M, Gerhardinger C, Lorenzi M. Müller cell changes in human diabetic retinopathy. Diabetes 1998;47:445–449 - PubMed

Publication types

MeSH terms