. 2012 Mar 2;287(10):7411-26.
doi: 10.1074/jbc.M111.277103. Epub 2012 Jan 6.

CHCM1/CHCHD6, novel mitochondrial protein linked to regulation of mitofilin and mitochondrial cristae morphology

Affiliations

CHCM1/CHCHD6, novel mitochondrial protein linked to regulation of mitofilin and mitochondrial cristae morphology

Jie An et al. J Biol Chem. .

Abstract

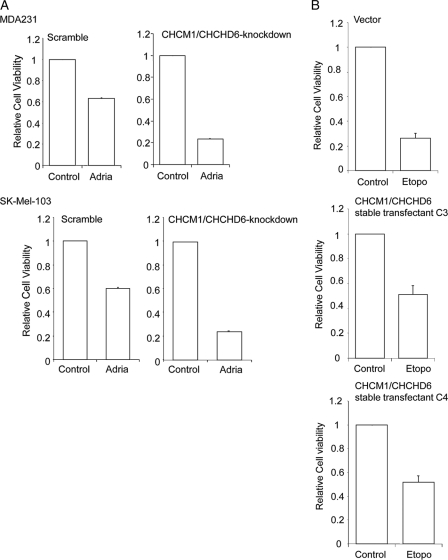
The structural integrity of mitochondrial cristae is crucial for mitochondrial functions; however, the molecular events controlling the structural integrity and biogenesis of mitochondrial cristae remain to be fully elucidated. Here, we report the functional characterization of a novel mitochondrial protein named CHCM1 (coiled coil helix cristae morphology 1)/CHCHD6. CHCM1/CHCHD6 harbors a coiled coil helix-coiled coil helix domain at its C-terminal end and predominantly localizes to mitochondrial inner membrane. CHCM1/CHCHD6 knockdown causes severe defects in mitochondrial cristae morphology. The mitochondrial cristae in CHCM1/CHCHD6-deficient cells become hollow with loss of structural definitions and reduction in electron-dense matrix. CHCM1/CHCHD6 depletion also leads to reductions in cell growth, ATP production, and oxygen consumption. CHCM1/CHCHD6 through its C-terminal end strongly and directly interacts with the mitochondrial inner membrane protein mitofilin, which is known to also control mitochondrial cristae morphology. CHCM1/CHCHD6 also interacts with other mitofilin-associated proteins, including DISC1 and CHCHD3. Knockdown of CHCM1/CHCHD6 reduces mitofilin protein levels; conversely, mitofilin knockdown leads to reduction in CHCM1 levels, suggesting coordinate regulation between these proteins. Our results further indicate that genotoxic anticancer drugs that induce DNA damage down-regulate CHCM1/CHCHD6 expression in multiple human cancer cells, whereas mitochondrial respiratory chain inhibitors do not affect CHCM1/CHCHD6 levels. CHCM1/CHCHD6 knockdown in human cancer cells enhances chemosensitivity to genotoxic anticancer drugs, whereas its overexpression increases resistance. Collectively, our results indicate that CHCM1/CHCHD6 is linked to regulation of mitochondrial cristae morphology, cell growth, ATP production, and oxygen consumption and highlight its potential as a possible target for cancer therapeutics.


Figures

FIGURE 1.
FIGURE 1.
A, schematic illustration and amino acid sequence of CHCM1/CHCHD6. DUF, domain of unknown function. Cysteines in the CX9CCX9C motif are highlighted in different color. B, expression of exogenous CHCM1/CHCHD6 in HEK293T cells. V, vector only; N, HA-S tagged at the N terminus of CHCM1/CHCHD6; C, HA-S tagged at the C terminus of CHCM1/CHCHD6. The N-tagged CHCM1/CHCHD6 migrates more slowly because there are three HA tags.
FIGURE 2.
FIGURE 2.
CHCM1/CHCHD6 is a mitochondrial protein. A, representative fluorescent photomicrographs showing the subcellular distribution of exogenous HA-tagged CHCM1/CHCHD6 (green) and mitochondria-specific RFP (red) in MCF7 cells. B, representative fluorescent photomicrographs showing the subcellular distribution of endogenous CHCM1/CHCHD6 (green) and MitoTracker staining (red) in uacc62 cells. Cells were also stained with DAPI nuclear stain. C, subcellular distribution of endogenous CHCM1/CHCHD6 in multiple cell lines. CHCM1/CHCHD6 distribution was determined by the cell fractionation method followed by Western blot analyses. T, total cell lysate; C, cytosolic fraction; M, mitochondrial fraction. Tim23, a mitochondrial protein, was used as a control.
FIGURE 3.
FIGURE 3.
A, submitochondrial distribution of CHCM1/CHCHD6. Shown are Western blot analyses of submitochondrial fractions. Submitochondrial fractions were prepared using RKO cells as described under “Experimental Procedures.” MT, total mitochondria fraction. B, sodium carbonate extraction-based distribution of CHCM1/CHCHD6. Western blot analyses of samples from sodium carbonate extraction assay in RKO and MCF7 cells. S100, soluble fraction; S240, membrane-associated fraction; P240, integral membrane fraction. p97 serves as a marker of soluble and membrane-associated fractions, and Tim23 serves as a marker of integral membrane fraction.
FIGURE 4.
FIGURE 4.
Genotoxic stress down-regulates CHCM1/CHCHD6. A, Northern blot analyses showing the effect of genotoxic etoposide on CHCM1/CHCHD6 mRNA expression in the indicated cell lines. C, control; E, etoposide, 30 μm for 24 h. B, effect of doxorubicin (Adriamycin) on CHCM1/CHCHD6 mRNA levels in RKO cells. Cells were treated with Adriamycin (0.5 μm) for the indicated times in hours. C, untreated controls. C, Western blot analyses showing DNA damage down-regulation of CHCM1/CHCHD6 protein levels in the indicated cell lines. C, control; E, etoposide, 30 μm for 24 h; A, Adriamycin, 1.0 μm for 24 h.
FIGURE 5.
FIGURE 5.
CHCM1/CHCHD6 depletion reduces cell growth. A, Northern and Western blot analyses showing CHCM1/CHCHD6 knockdown in RKO and MCF7 cell lines. S, scramble. G4, G5, G6, G7, and G8 are different CHCM1/CHCHD6-shRNA constructs. B, MTT assays showing cell growth in scramble or CHCM1/CHCHD6 knockdown cells representing RKO, MCF7, and MDA231 cell lines. G4 and G8 are two different CHCM1/CHCHD6-shRNA constructs. Values represent mean ± S.E. (error bars) of triplicate samples.
FIGURE 6.
FIGURE 6.
CHCM1/CHCHD6 depletion and overexpression alters chemosensitivity of human cancer cells to genotoxic anticancer drugs. A, CHCM1/CHCHD6 knockdown increases cellular sensitivity to doxorubicin (Adriamycin). MDA231 and SK-Mel-103 cells were untreated or treated with Adriamycin (Adria; 3 μm for MDA231 and 1 μm for SK-Mel-103) for 24 h, and cell viability was assessed by an MTT assay. Values represent mean ± S.E. (error bars) of triplicate samples. B, stable overexpression of CHCM1/CHCHD6 reduces cellular sensitivity to etoposide. RKO cells stably expressing exogenous CHCM1/CHCHD6 or vector-transfected cells were untreated or treated with etoposide (30 μm) for 48 h, and cell viability was determined by an MTT assay. C3 and C4 are two independent CHCM1/CHCHD6 stable transfectants. Values represent mean ± S.E. of triplicate samples.
FIGURE 7.
FIGURE 7.
CHCM1/CHCHD6 interacts with mitofilin, DISC1, and CHCHD3. A, exogenous CHCM1/CHCHD6 interacts with endogenous mitofilin. S-tag pull-down analyses were performed on vector-transfected or CHCM1/CHCHD6-transfected RKO cells. CHCM1/CHCHD6-B4 and CHCM1/CHCHD6-C3 are independent stable transfectants that express exogenous HA-S-tagged CHCM1/CHCHD6. S-tag pull-down was done with S-tag-agarose beads, and Western blot analyses were done with the indicated antibodies. B, endogenous CHCM1/CHCHD6 interacts with endogenous mitofilin. RKO and MCF7 cell lysates were used for CHCM1/CHCHD6 immunoprecipitation (IP) by anti-CHCM1/CHCHD6 antibody, and Western blot analyses (IB) were done with the indicated antibodies. NS, nonspecific binding. C, exogenous CHCM1/CHCHD6 interacts with endogenous DISC1 and CHCHD3. S-tag pull-down analyses were performed on crude mitochondria lysate from vector-transfected or CHCM1/CHCHD6-transfected RKO cells. CHCM1/CHCHD6-B4 and CHCM1/CHCHD6-C3 are independent stable transfectants that express exogenous HA-S-tagged CHCM1/CHCHD6. S-tag pull-down was done with S-tag-agarose beads, and Western blot analysis was done with the indicated antibodies. D, endogenous CHCM1/CHCHD6 interacts with endogenous DISC1 and CHCHD3. Crude mitochondria lysate from RKO cell was used for CHCM1/CHCHD6 immunoprecipitation by anti-CHCM1/CHCHD6 antibody, and Western blot analyses were done with the indicated antibodies.
FIGURE 8.
FIGURE 8.
CHCM1/CHCHD6 knockdown affects mitochondria cristae morphology. Shown are EM analyses of scramble and CHCM1/CHCHD6 knockdown RKO (A) and MCF7 cells (B). Black arrows, normal mitochondria. White arrows, mitochondria with abnormal cristae structures.
FIGURE 9.
FIGURE 9.
CHCM1/CHCHD6 directly interacts with mitofilin via its C-terminal end. A, direct interaction between CHCM1/CHCHD6 and mitofilin. Purified S-tagged full-length CHCM1/CHCHD6 was incubated with gel-purified mitofilin-GST or GST proteins, and S-tag pull-down assays were performed. The pull-down protein products were analyzed by Western blot (IB) using anti-S or anti-GST antibodies. B, schematic illustration of the full-length and deletion variants of CHCM1/CHCHD6 protein. C, Coomassie Blue staining of recombinant full-length and deletion variants of CHCM1/CHCHD6 from bacteria lysate. S-tag pull-down of recombinant full-length and deletion variants of CHCM1/CHCHD6 was performed on bacteria lysates. The CHCM1/CHCHD6 protein products are indicated by asterisks. D, mapping of CHCM1/CHCHD6 and mitofilin interaction region on CHCM1/CHCHD6. Left, purified S-tagged full-length CHCM1/CHCHD6 and deletion variants were incubated with gel-purified mitofilin-GST or GST protein. Then S-tag pull-downs were performed. The pull-down protein products were analyzed by Western blot using anti-S and anti-GST antibodies. Right, Western blot analysis of ∼1% input of purified GST and mitofilin-GST proteins.
FIGURE 10.
FIGURE 10.
CHCM1/CHCHD6 and mitofilin are coordinately regulated. A, Western blot analysis of mitofilin levels in scramble (scr) or CHCM1/CHCHD6 knockdown SK-Mel-103 and RKO cells. B, Western blot analysis of CHCM1/CHCHD6 levels in scramble or mitofilin knockdown SK-Mel-103 and RKO cells. Western blot analyses were performed using anti-CHCM1/CHCHD6 or anti-mitofilin antibodies. C, Western blot analysis of mitofilin levels in two independent stable transfectants (B4 and C3) that express exogenous HA-S-tagged CHCM1/CHCHD6. Respective blots were also probed with anti-β-actin antibody as loading control. Results in C are the same as shown also for input in Fig. 7A.
FIGURE 11.
FIGURE 11.
CHCM1/CHCHD6 deficiency induces mitochondrial dysfunction. A, CHCM1/CHCHD6 knockdown affects cellular ATP production. ATP levels in scrambled and CHCM1/CHCHD6 knocked down cells were determined as described under “Experimental Procedures.” G4 and G8 are two independent knockdown cells achieved via two different CHCM1/CHCHD6-shRNA constructs. Values represent average ± S.E. (error bars) of four independent experiments. *, p < 0.05. B, CHCM1/CHCHD6 knockdown affects oxygen consumption rate. Oxygen consumption rates in scrambled and CHCM1/CHCHD6 knocked down cells were determined as described under “Experimental Procedures.” G4 and G8 are two independent knockdown cells achieved via two different CHCM1/CHCHD6-shRNA constructs. Values represent average ± S.E. of three independent experiments. *, p < 0.05.

Similar articles

Cited by

References

    1. Czarnecka A. M., Marino Gammazza A., Di Felice V., Zummo G., Cappello F. (2007) Cancer as a “Mitochondriopathy.” J. Cancer Mol. 3, 71–79
    1. Kirkinezos I. G., Moraes C. T. (2001) Reactive oxygen species and mitochondrial diseases. Semin. Cell Dev. Biol. 12, 449–457 - PubMed
    1. Toyokuni S., Okamoto K., Yodoi J., Hiai H. (1995) Persistent oxidative stress in cancer. FEBS Lett. 358, 1–3 - PubMed
    1. Warburg O. (1956) On the origin of cancer cells. Science 123, 309–314 - PubMed
    1. Carew J. S., Huang P. (2002) Mitochondrial defects in cancer. Mol. Cancer. 1, 9. - PMC - PubMed

Publication types

MeSH terms

Associated data