

Imaging Natural Occlusal Caries Lesions with Optical Coherence Tomography
- PMID: 22228981
- PMCID: PMC3251261
- DOI: 10.1117/12.849344
Imaging Natural Occlusal Caries Lesions with Optical Coherence Tomography
Abstract
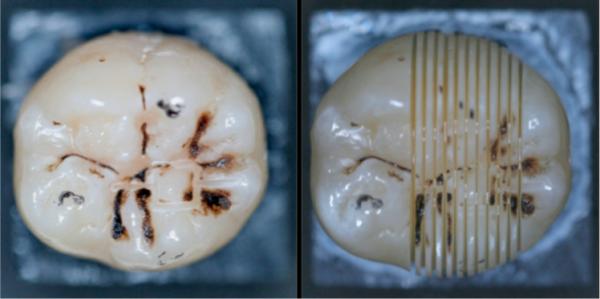
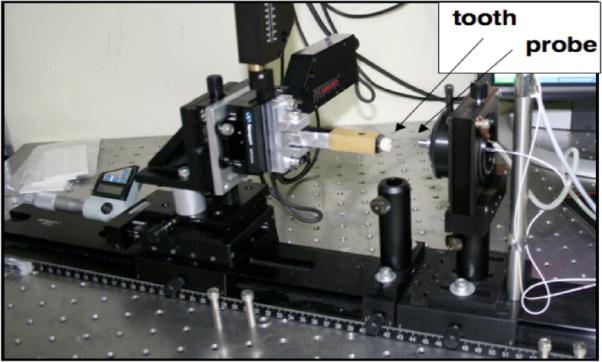
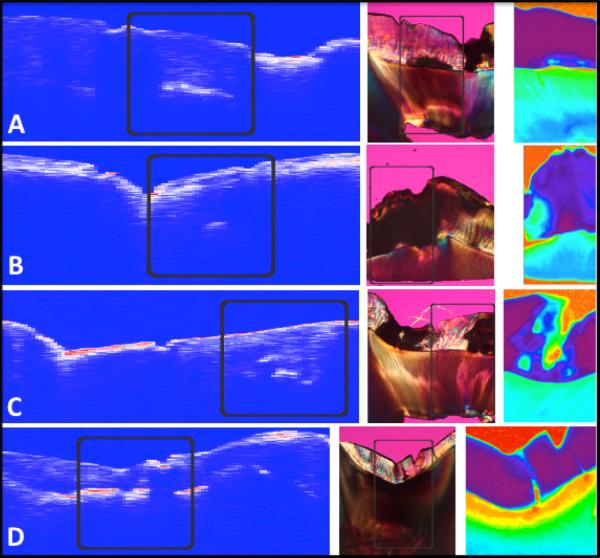
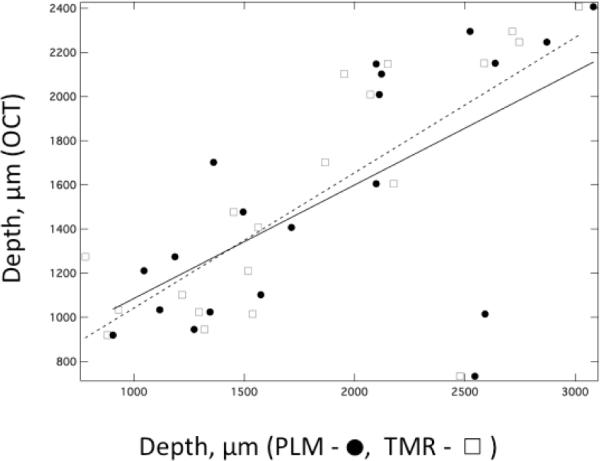
Several studies have demonstrated that polarization-sensitive optical coherence tomography (PS-OCT) can be used to nondestructively measure the severity of demineralization in the important occlusal surfaces. The purpose of this study was to assess the potential of PS-OCT and OCT methods for the measurement of the depth of natural occlusal carious lesions. Teeth were screened for potential occlusal lesions using near infrared imaging (NIR). A PS-OCT system operating at 1310-nm was used to acquire polarization resolved images of the area of interest on the occlusal surface. The teeth were serial sectioned to 200 μm thickness and examined with polarized light microscopy (PLM) and Transverse Microradiography (TMR) for comparison. The lesion depth measured nondestructively with PS-OCT was compared to the lesion depth measured with PLM and TMR to assess the performance of these methods and determine if polarization sensitivity is required. The lesion depth measured using OCT correlated well with the lesion depths measured with TMR and PLM. Although polarization sensitivity provided better contrast it was not necessary to have polarization sensitivity to identify deep occlusal lesions.
Figures
References
-
- Hume WR. Early Detection of Dental Caries I. Indiana University; 1996. Need for change in dental caries diagnosis; pp. 1–10.
-
- Featherstone JDB. Early Detection of Dental Caries. Indiana University; 1996. Clinical Implications:New Strategies for Caries Prevention; pp. 287–296.
-
- ten Cate JM, van Amerongen JP. Early Detection of Dental Caries. Indiana University; 1996. Caries Diagnosis: Conventional Methods; pp. 27–37.
-
- Featherstone JDB. Prevention and reversal of dental caries:role of low level fluoride. Community Dent Oral Epidemiol. 1999;27:31–40. - PubMed
-
- NIH Diagnosis and Management of Dental Caries throughout Life. NIH Consensus Statement. 2001:1–24. - PubMed
Grants and funding
LinkOut - more resources
Full Text Sources
Other Literature Sources
Miscellaneous