. 2012 Feb 8;134(5):2781-7.
doi: 10.1021/ja2105653. Epub 2012 Jan 26.

Protein detection by nanopores equipped with aptamers

Affiliations
Free PMC article

Protein detection by nanopores equipped with aptamers

Dvir Rotem et al. J Am Chem Soc. .
Free PMC article

Abstract

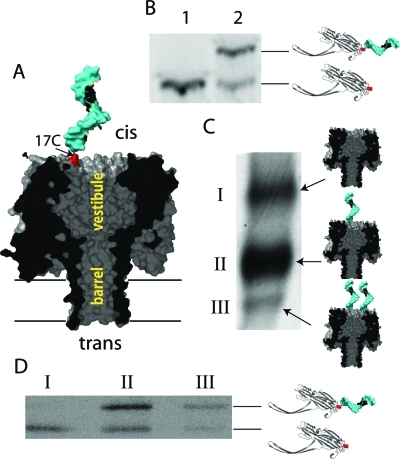
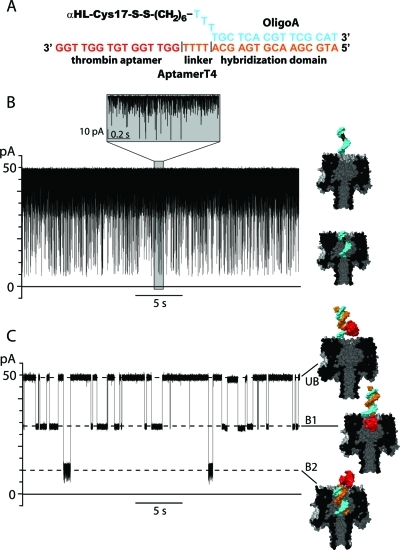
Protein nanopores have been used as stochastic sensors for the detection of analytes that range from small molecules to proteins. In this approach, individual analyte molecules modulate the ionic current flowing through a single nanopore. Here, a new type of stochastic sensor based on an αHL pore modified with an aptamer is described. The aptamer is bound to the pore by hybridization to an oligonucleotide that is attached covalently through a disulfide bond to a single cysteine residue near a mouth of the pore. We show that the binding of thrombin to a 15-mer DNA aptamer, which forms a cation-stabilized quadruplex, alters the ionic current through the pore. The approach allows the quantification of nanomolar concentrations of thrombin, and provides association and dissociation rate constants and equilibrium dissociation constants for thrombin·aptamer interactions. Aptamer-based nanopores have the potential to be integrated into arrays for the parallel detection of multiple analytes.


Figures

Figure 1
Figure 1
Attachment of a single DNA oligonucleotide to the αHL pore. (a) Cross-section of a model showing an αHL pore chemically modified with a single DNA oligonucleotide. The oligonucleotide is attached by a hexamethylene linker and a disulfide bond to Cys-17 of a single genetically engineered subunit within a heptameric αHL pore. The model was made with PyMOL software (www.pymol.org) based on the pdb files 7AHL (αHL, gray) and 3IAG (ssDNA, light blue). (b) Autoradiogram of an SDS-polyacrylamide gel (Criterion XT Precast Gel, 10% acrylamide) showing αHL N17C monomers before (lane 1) and after (lane 2) reaction with the activated oligoA oligonucleotide. Schematic representations of αHL N17C monomers with and without an attached oligoA are shown. (c) Autoradiogram of an SDS-polyacrylamide gel (Tris.HCl gel, 5% acrylamide) showing unheated samples of αHL heptamers formed on rabbit red blood cell membranes with a mixture of 35S-labeled N17C-oligoA monomers and excess unlabeled WT monomers. Schematic representations of αHL pores with 0, 1, or 2 attached oligoA oligonucleotides are shown. (d) Autoradiogram of an SDS-polyacrylamide gel of polypeptides found in the bands from part c. The samples were extracted from the first gel, denatured (10 min, 95 °C in XT sample buffer, Bio-Rad) and run in second gel (Criterion XT Precast Gel, 10% acrylamide). Note that the mobility of heptameric αHL in SDS-polyacrylamide gels is increased after modification with DNA, while the mobility of monomers is decreased by DNA attachment.
Figure 2
Figure 2
αHL pore with a thrombin aptamer attached by DNA hybridization. (a) The DNA duplex formed between oligoA and aptamerT4. (b, c) Representative single-channel recordings from the αHL-oligoA1 pore (b) before and (c) after hybridization to aptamerT4. The measurements were performed in 1 M KCl, buffered with 10 mM Tris.HCl, pH 7.2, at +50 mV. The traces were filtered at 1 kHz. The models are based on pdb files 7AHL (αHL, gray), 3IAG (dsDNA, light blue and orange), and 148D (thrombin aptamer, red). Before hybridization to the DNA duplex, the DNA adapter moves in and out of the pore creating short, frequent blocking events as seen in part b. After hybridization of the aptamer, two blockade levels are observed, B1 and B2, as shown in part c. The B1 level is generated by movement of the quadruplex domain into the vestibule of the pore, while the B2 level arises from the insertion of the dsDNA segment into the pore (see the text).
Figure 3
Figure 3
Detection of the interactions between thrombin and aptamerT4. Representative single-channel recordings of αHL-oligoA1·aptamerT4 (a) before and (b) after the addition of 80 nM thrombin (final concentration) to the cis chamber. The measurements were performed in 1 M KCl, buffered with 10 mM Tris.HCl, pH 7.2, at +50 mV. In the presence of thrombin, a new elevated current level (UB+T) was observed and the frequency of the B1 blockades was reduced. The upper panels are enlargements of the gray boxes in the lower panels. The traces were filtered at 50 Hz. (c) A kinetic model for the transitions between the various currents levels observed in the presence of thrombin. The models are based on pdb files 7AHL (αHL, gray), 3IAG (dsDNA, light blue and orange), 148D (thrombin aptamer, red), and 1HUT (thrombin and thrombin·aptamer complex, green and green plus red, respectively).
Figure 4
Figure 4
Nature of the linker between the hybridization and the aptamer domains affects aptamer insertion into the pore vestibule. (a) Sequences and representative traces of αHL-oligoA1 pores hybridized with various aptamer oligonucleotides: aptamerT1, aptamerT4, aptamerT7, and aptamerΔ3. The measurements were performed in 1 M KCl, 10 mM Tris.HCl, pH 7.2, at +50 mV. The traces were filtered at 1 kHz. (b) Kinetic model describing the observed transitions. (c) Rates of the transitions from UB to B1. (d) Rates of the transitions from B1 to UB. The models are based on pdb files 7AHL (αHL, gray), 3IAG (dsDNA, light blue and orange), and 148D (thrombin aptamer, red). All measurements were conducted at least 3 times.
Figure 5
Figure 5
Dependence of the rates of the transitions between the UB and UB+T current levels on thrombin concentration. (a) AptamerT1, triangles; (b) aptamerT4, squares. Association rates, filled symbols; dissociation rates, empty symbols. The rates were calculated with QuB on the basis of the kinetic model (Figure 3b). The measurements were performed in 1 M KCl, 10 mM Tris.HCl, pH 7.2, at +50 mV, and were conducted at least 3 times.

References

    1. Bayley H.; Martin C. R. Chem. Rev. 2000, 100, 2575–2594. - PubMed
    1. Bayley H.; Cremer P. S. Nature 2001, 413, 226–230. - PubMed
    1. Dekker C. Nat. Nanotechnol. 2007, 2, 209–15. - PubMed
    1. Sexton L. T.; Horne L. P.; Martin C. R. Mol. Biosyst. 2007, 3, 667–85. - PubMed
    1. Howorka S.; Siwy Z. Chem. Soc. Rev. 2009, 38, 2360–84. - PubMed

Publication types