. 2012 Jul;166(5):1654-68.
doi: 10.1111/j.1476-5381.2012.01837.x.

A novel µ-conopeptide, CnIIIC, exerts potent and preferential inhibition of NaV1.2/1.4 channels and blocks neuronal nicotinic acetylcholine receptors

Affiliations

A novel µ-conopeptide, CnIIIC, exerts potent and preferential inhibition of NaV1.2/1.4 channels and blocks neuronal nicotinic acetylcholine receptors

Philippe Favreau et al. Br J Pharmacol. 2012 Jul.

Abstract

Background and purpose: The µ-conopeptide family is defined by its ability to block voltage-gated sodium channels (VGSCs), a property that can be used for the development of myorelaxants and analgesics. We characterized the pharmacology of a new µ-conopeptide (µ-CnIIIC) on a range of preparations and molecular targets to assess its potential as a myorelaxant.

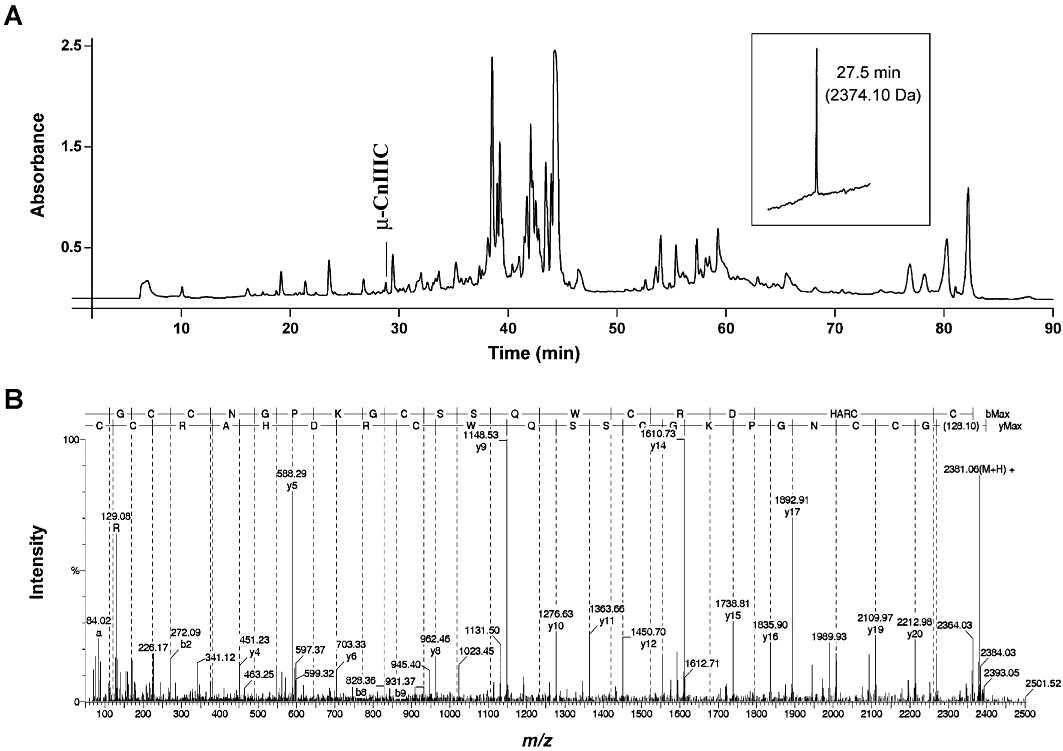
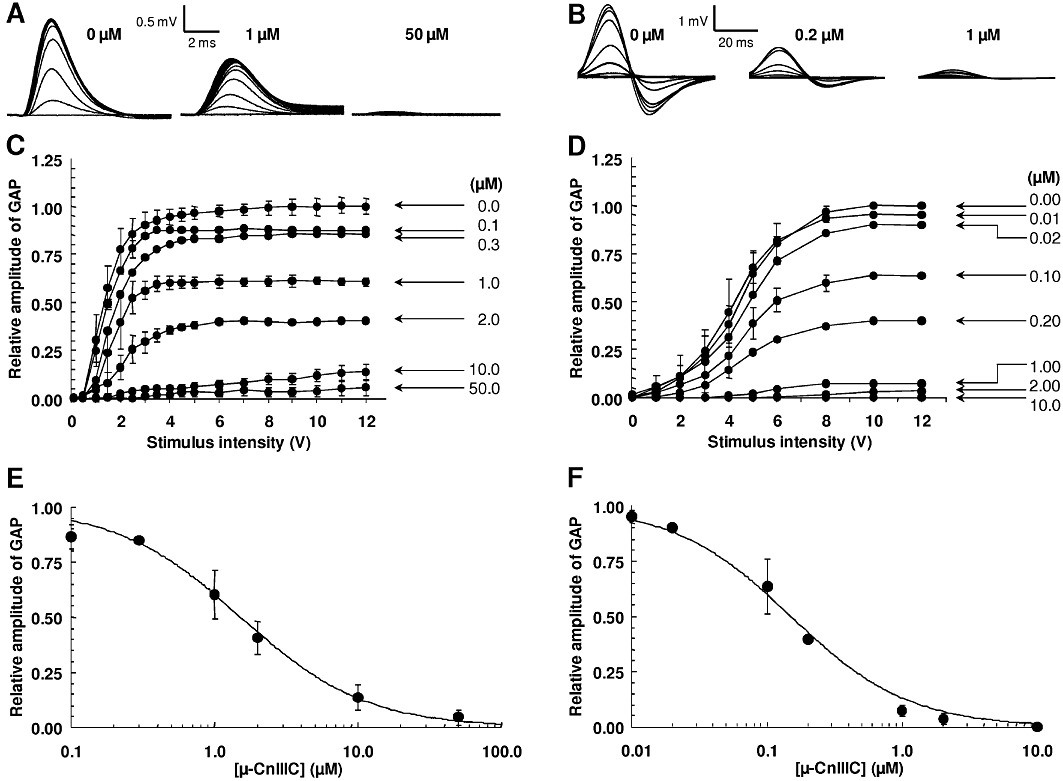
Experimental approach: µ-CnIIIC was sequenced, synthesized and characterized by its direct block of elicited twitch tension in mouse skeletal muscle and action potentials in mouse sciatic and pike olfactory nerves. µ-CnIIIC was also studied on HEK-293 cells expressing various rodent VGSCs and also on voltage-gated potassium channels and nicotinic acetylcholine receptors (nAChRs) to assess cross-interactions. Nuclear magnetic resonance (NMR) experiments were carried out for structural data.

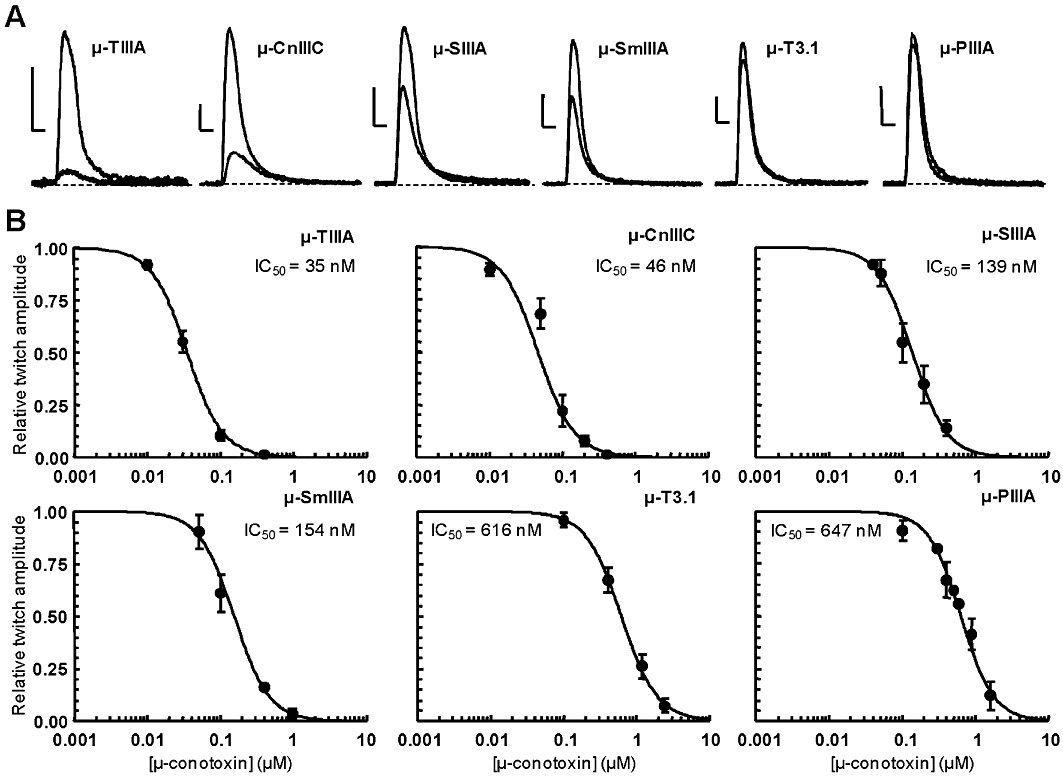
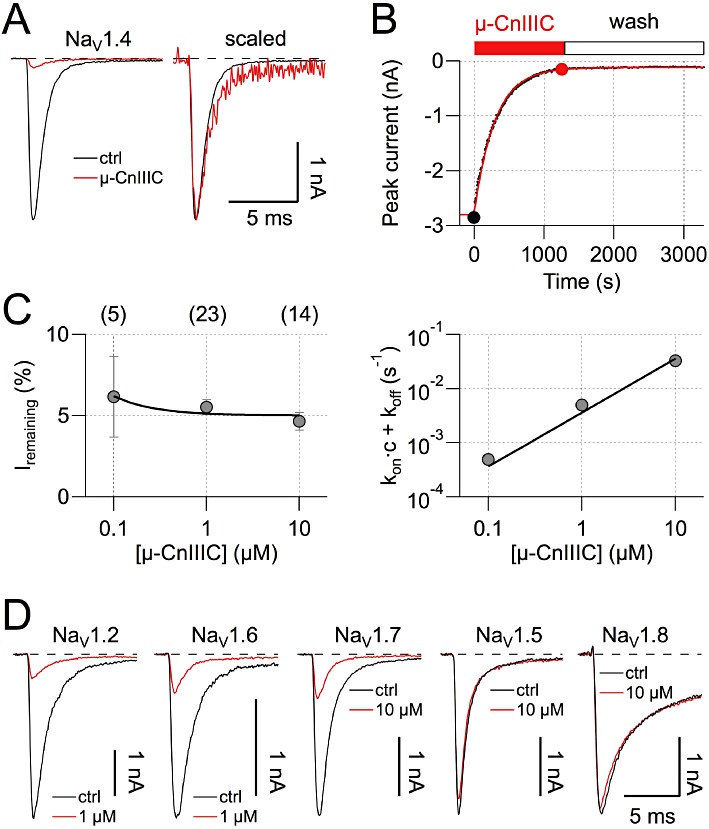
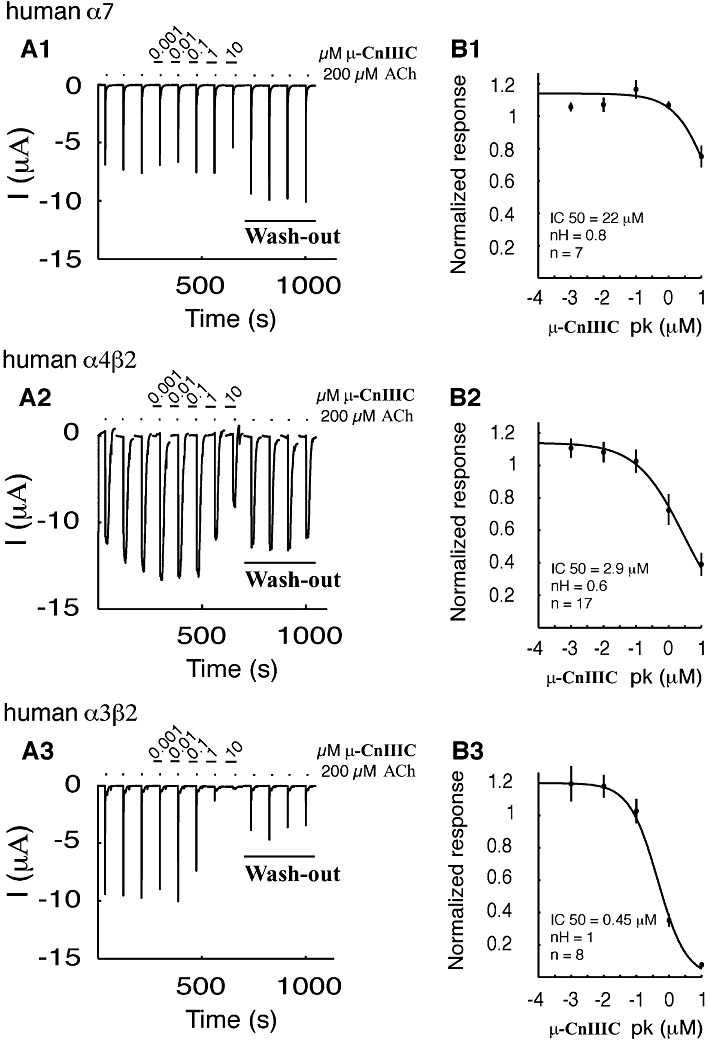
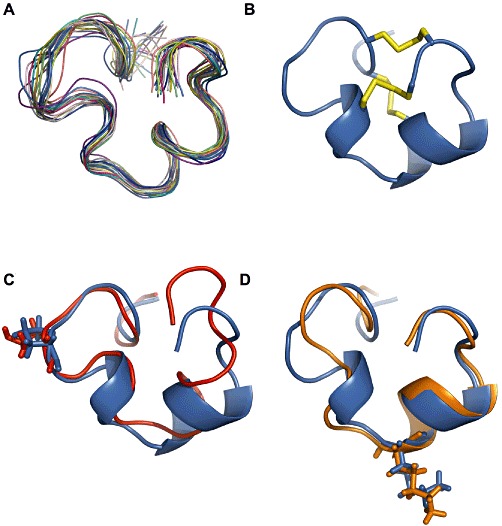
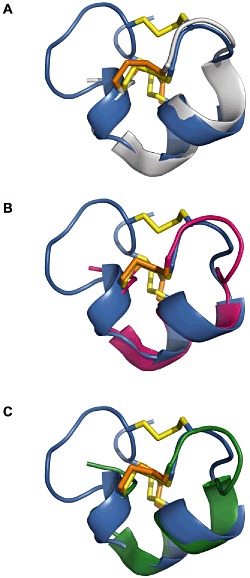
Key results: Synthetic µ-CnIIIC decreased twitch tension in mouse hemidiaphragms (IC(50) = 150 nM), and displayed a higher blocking effect in mouse extensor digitorum longus muscles (IC = 46 nM), compared with µ-SIIIA, µ-SmIIIA and µ-PIIIA. µ-CnIIIC blocked Na(V)1.4 (IC(50) = 1.3 nM) and Na(V)1.2 channels in a long-lasting manner. Cardiac Na(V)1.5 and DRG-specific Na(V)1.8 channels were not blocked at 1 µM. µ-CnIIIC also blocked the α3β2 nAChR subtype (IC(50) = 450 nM) and, to a lesser extent, on the α7 and α4β2 subtypes. Structure determination of µ-CnIIIC revealed some similarities to α-conotoxins acting on nAChRs.

Conclusion and implications: µ-CnIIIC potently blocked VGSCs in skeletal muscle and nerve, and hence is applicable to myorelaxation. Its atypical pharmacological profile suggests some common structural features between VGSCs and nAChR channels.


Figures

Figure 1
Figure 1
Isolation and characterization of µ-CnIIIC. (A) Reverse-phase HPLC chromatogram (monitored by absorbance at 214 nm) of the venom duct extract from Conus consors. The peak eluting at ∼28 min contained µ-CnIIIC that was purified to homogeneity at an analytical scale and showed a single monoisotopic molecular mass (inset). The peptide was then subjected to reduction and mass spectrometry analysis. (B) ESI-MS/MS spectrum of the the m/z 596 undergoing collision-induced dissociation. The good fragmentation coverage allowed complete amino acid sequence assignment with y and b ions.
Figure 2
Figure 2
Effects of different µ-conotoxins on isometric twitch tension elicited by direct electrical stimulation of isolated mouse EDL muscles. (A) Effects of µ-conotoxins on skeletal muscle contraction. Contractions evoked by direct muscle stimulation and recorded in the absence and presence of 0.1 µM µ-conotoxins. Scale bars: 0.2 g (vertical) and 0.1 s (horizontal). (B) Concentration–response curves of peptide effects on directly elicited muscle contraction. For each µ-conopeptide concentration, the maximal twitch peak amplitude is expressed relative to its control value as the mean ± SEM of three to six experiments. The theoretical curves were calculated from typical sigmoidal nonlinear regression through data points (correlation coefficient r2≥ 0.948). The µ-conopeptide concentration that inhibited 50% of the twitch tension (IC50) is indicated for each peptide studied.
Figure 3
Figure 3
Effect of µ-CnIIIC on the GAP recorded on isolated mouse sciatic and pike olfactory nerves. (A–B) Traces of GAP recorded in response to 0.05 ms (mouse) and 8 ms (pike) and 0.1–15 V stimulations, under control conditions and after treatment with µ-CnIIIC at the indicated concentrations. (C–D) GAP amplitude in response to different intensities of 0.05 and 8 ms stimulations and to different concentrations of µ-CnIIIC. (E–F) GAP amplitude in the presence of various concentrations of µ-CnIIIC, and expressed relative to control values as mean ± SEM of three to six mouse sciatic and three to four pike olfactory nerves. The curves were calculated from typical sigmoidal nonlinear regression through data points (r2≥ 0.984). The µ-CnIIIC concentrations required to block 50% of the GAP amplitude (IC50) was 1.53 µM (mouse) and 0.15 µM (pike).
Figure 4
Figure 4
Effect of µ-CnIIIC on voltage-gated sodium channels. (A) Sodium currents at −20 mV recorded from HEK 293 cells expressing rat NaV1.4 channels, under control conditions and in the presence of 1 µM µ-CnIIIC (red). Holding potential was −120 mV, leak was corrected with a p/6 method. The panel on the right shows currents in the presence of toxin scaled and superimposed on the control current, indicating a lack of kinetic changes. (B) NaV1.4 peak current inhibition by µ-CnIIIC and wash-out with a conotoxin-free medium shown as a function of time. The continuous red curve is a single exponential; filled circles indicate data points corresponding to traces shown in (A). (C) The remaining current after toxin equilibration (left) as a function of µ-CnIIIC concentration and the inverse of the time constant characterizing the onset of block (right) as a function of µ-CnIIIC concentration. The number of experiments is indicated in parentheses. The continuous lines are global data fits assuming a first-order reaction yielding an apparent IC50 value of 1.3 ± 0.4 nM and a negligible off-rate. Error bars indicate SEM. (D) Current traces as in A for the indicated channel types before (black) and after application of µ-CnIIIIC at the indicated concentration (red). Traces for rat NaV1.8 channels were recorded from Neuro-2A cells at 10 mV in the presence of 1 µM TTX.
Figure 5
Figure 5
Effect of µ-CnIIIC on nAChRs expressed in Xenopus oocytes. (A1-A3) presents the inhibition of acetylcholine-induced currents on human α7 (A1), α4β2 (A2) and α3β2 (A3) nAChRs. All recordings were carried out at −100 mV and the first three traces are controls followed by concentration-dependent response to 2 min exposure to different concentrations of µ-CnIIIC, ranging from 1 nM to 10 µM. Each experiment was terminated by wash-out steps for a time period of 8 min. Complete wash-out was observed for α7 and α4β2, while only partial recovery occurred for α3β2. (B1–3) Inhibition curves of the fitted data. IC50, Hill coefficient (nH) and experimental numbers are presented under the fitted curve for α7 (B1), α4β2 (B2) and α3β2 (B3). Error bars indicate SEM.
Figure 6
Figure 6
Structure of µ-CnIIIC. (A) Backbone superimposition over residues 3–22 for the 20 lowest energy structures (ribbon). (B) Lowest energy structure with the disulfide bridge shown in yellow. (C) Backbone superimposition of N-terminal region (residues 3–11) of µ-CnIIIC (blue) with N-terminal region (residues 4–12) of µ-TIIIA (red); Pro7 and Hyp8 of µ-CnIIIC and µ-TIIIA respectively are highlighted (sticks). (D) Backbone superimposition of C-terminal region (residues 12–22) of µ-CnIIIC (blue) with C-terminal region (residues 10–20) of µ-SIIIA (orange); Lys13 and Lys11 of µ-CnIIIC and µ-SIIIA respectively are highlighted (sticks). Structural data were used from biological magnetic resonance bank (BMRB) accession codes 20024 (TIIIA) and 20025 (SIIIA). µ-CnIIIC structural data can be accessed with protein databank (PDB) code 2YEN and BMRB accession code 17581.
Figure 7
Figure 7
Structure comparison of µ-CnIIIC with α-conotoxins. (A–C) Backbone superimposition over Cα atoms of µ-CnIIIC (blue) with α-AuIB (grey), α-PnIA (magenta) and α-Vc1.1 (green). Disulfide bonds are shown in yellow for µ-CnIIIC and orange for the α-conotoxins. Protein databank (PDB) codes are 1DG2 (AuIB), 1PEN (PnIA) and 2H8S (Vc1.1).

Similar articles

Cited by

References

    1. Alexander SPH, Mathie A, Peters JA. Guide to Receptors and Channels (GRAC), 5th Edition. Br J Pharmacol. 2011;164(Suppl. 1):S1–S324. - PMC - PubMed
    1. Bax A, Davis DG. MLEV-17 based two-dimensional homonuclear magnetization transfer spectroscopy. J Magn Reson. 1985;65:355–360.
    1. Brünger AT, Adams PD, Clore GM, DeLano WL, Gros P, Grosse-Kunstleve RW, et al. Crystallography & NMR system: a new software suite for macromolecular structure determination. Acta Crystallogr D Biol Crystallogr. 1998;54:905–921. - PubMed
    1. Buczek O, Bulaj G, Olivera BM. Conotoxins and the posttranslational modification of secreted gene products. Cell Mol Life Sci. 2005;62:3067–3079. - PMC - PubMed
    1. Bulaj G, West PJ, Garrett JE, Watkins M, Zhang MM, Norton RS, et al. Novel conotoxins from Conus striatus and Conus kinoshitai selectively block TTX-resistant sodium channels. Biochemistry. 2005;44:7259–7265. - PubMed

Publication types

MeSH terms