. 2012 Jan 10:7:2.
doi: 10.1186/1745-6150-7-2.

On the molecular mechanism of GC content variation among eubacterial genomes

Affiliations

On the molecular mechanism of GC content variation among eubacterial genomes

Hao Wu et al. Biol Direct. .

Abstract

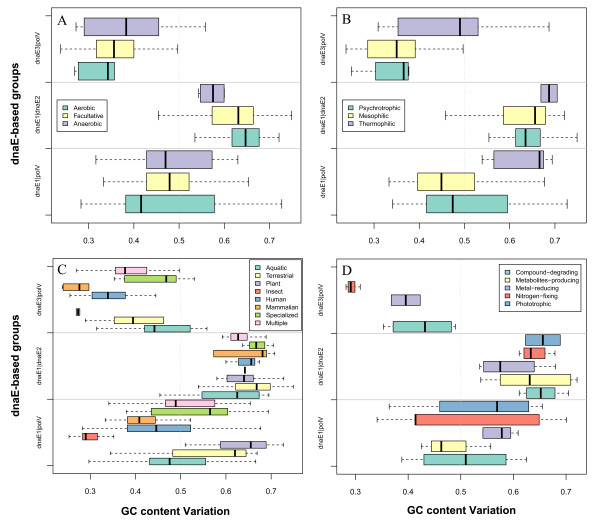
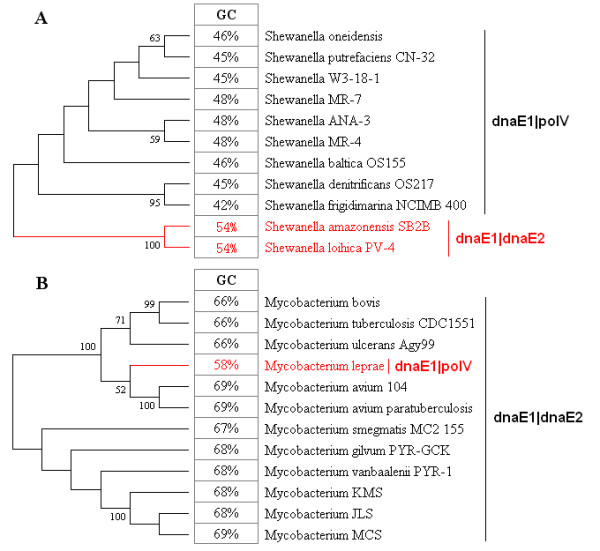
Background: As a key parameter of genome sequence variation, the GC content of bacterial genomes has been investigated for over half a century, and many hypotheses have been put forward to explain this GC content variation and its relationship to other fundamental processes. Previously, we classified eubacteria into dnaE-based groups (the dimeric combination of DNA polymerase III alpha subunits), according to a hypothesis where GC content variation is essentially governed by genome replication and DNA repair mechanisms. Further investigation led to the discovery that two major mutator genes, polC and dnaE2, may be responsible for genomic GC content variation. Consequently, an in-depth analysis was conducted to evaluate various potential intrinsic and extrinsic factors in association with GC content variation among eubacterial genomes.

Results: Mutator genes, especially those with dominant effects on the mutation spectra, are biased towards either GC or AT richness, and they alter genomic GC content in the two opposite directions. Increased bacterial genome size (or gene number) appears to rely on increased genomic GC content; however, it is unclear whether the changes are directly related to certain environmental pressures. Certain environmental and bacteriological features are related to GC content variation, but their trends are more obvious when analyzed under the dnaE-based grouping scheme. Most terrestrial, plant-associated, and nitrogen-fixing bacteria are members of the dnaE1|dnaE2 group, whereas most pathogenic or symbiotic bacteria in insects, and those dwelling in aquatic environments, are largely members of the dnaE1|polV group.

Conclusion: Our studies provide several lines of evidence indicating that DNA polymerase III α subunit and its isoforms participating in either replication (such as polC) or SOS mutagenesis/translesion synthesis (such as dnaE2), play dominant roles in determining GC variability. Other environmental or bacteriological factors, such as genome size, temperature, oxygen requirement, and habitat, either play subsidiary roles or rely indirectly on different mutator genes to fine-tune the GC content. These results provide a comprehensive insight into mechanisms of GC content variation and the robustness of eubacterial genomes in adapting their ever-changing environments over billions of years.


Figures

Figure 1
Figure 1
GC content distribution in three dnaE-based groups. The grouping of dnaE1|polV, dnaE1|dnaE2, and dnaE3|polV are based on a collection of 364 non-redundant bacteria.
Figure 2
Figure 2
Bacteriological features and GC content variations. GC content variations across the three dnaE-based groups examined for different bacteriological features: oxygen requirement (A), thermal adaptation (B), habitat (C), and metabolic features (D).
Figure 3
Figure 3
Contribution of alpha-dimer asymmetry and optimal growth temperature (OGT) to GC content variation. This dataset contains 10 thermophilic bacteria of three different phyla (five from Firmicutes, two from Actinobacteria, and three from Thermotogae), which have a broad GC content (from 31% to 71%) and OGT (from 55°C to 80°C) variation. The solid circles denote bacteria of the dnaE3|polV group, with two exceptions (one, labeled in blue, which lost polC, and the other, labeled in red, has an insertion of dnaE2). The red squares denote bacteria of the dnaE1|dnaE2 group. The phylogenetic tree was constructed using the NJ method of MEGA 4.0 by using 16s rRNA sequences. Bootstrap values (>50) are labeled.
Figure 4
Figure 4
Correlation between dnaE2 gain-and-loss and GC content variation. In the Genus Shewanella, two bacteria (red) have higher GC content, which correlates well with the presence of the dnaE2 gene (A). Mycobacterium leprae has a lower GC content because it has lost the dnaE2 gene (B). The phylogenetic tree was constructed using the NJ method of MEGA 4.0 and 16s rRNA sequences. Bootstrap values (>50) are labeled.
Figure 5
Figure 5
Gene numbers across the dnaE-based groups. The box-plots show gene numbers (A) and the correlation between gene number and GC content variation (B) across the dnaE-based groups.
Figure 6
Figure 6
Linear correlation between genome size and GC content. Bacterial genome sizes are represented by the number of genes. Bacteria with less than 2,500 genes were chosen for analysis in dnaE1|polV (A) and dnaE3|polV (B), respectively. There is a strong and significant correlation between genome size and GC content after eliminating outliers (red solid circles). R values change from 0.6179 to 0.7479 (p < 0.0001) in the dnaE1|polV group and from 0.5571 to 0.8172 (p < 0.0001) in the dnaE3|polV group. The linear model is Y = 0.0001128X + 0.2387 for the dnaE1|polV group and Y = 0.00006374X + 0.2464 for the dnaE3|polV group. 90% upper and lower prediction limits are also shown. All the numbered outliers were further analyzed to interpret potential reasons underlying this correlation (Table 6).

Similar articles

Cited by

References

    1. Sueoka N. On the genetic basis of variation and heterogeneity of DNA base composition. Proc Natl Acad Sci USA. 1962;48:582–592. doi: 10.1073/pnas.48.4.582. - DOI - PMC - PubMed
    1. Li W, Grauer D. Fundamentals of Molecular Evolution. First. Sunderland MA: Sinauer Associates Inc; 1991.
    1. Belozersky AN, Spirin AS. A correlation between the compositions of deoxyribonucleic and ribonucleic acids. Nature. 1958;182:111–112. doi: 10.1038/182111a0. - DOI - PubMed
    1. Bernardi G. Codon usage and genome composition. J Mol Evol. 1985;22:363–365. doi: 10.1007/BF02115693. - DOI - PubMed
    1. Sharp PM, Devine KM. Codon usage and gene expression level in Dictyostelium discoideum: highly expressed genes do 'prefer' optimal codons. Nucleic Acids Res. 1989;17:5029–5039. doi: 10.1093/nar/17.13.5029. - DOI - PMC - PubMed

Publication types

LinkOut - more resources