. 2012 Jan 10:13:10.
doi: 10.1186/1471-2164-13-10.

Transcriptome changes during fruit development and ripening of sweet orange (Citrus sinensis)

Affiliations

Transcriptome changes during fruit development and ripening of sweet orange (Citrus sinensis)

Keqin Yu et al. BMC Genomics. .

Abstract

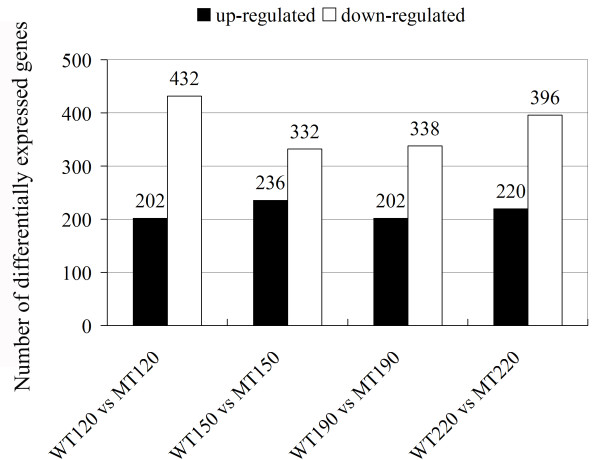
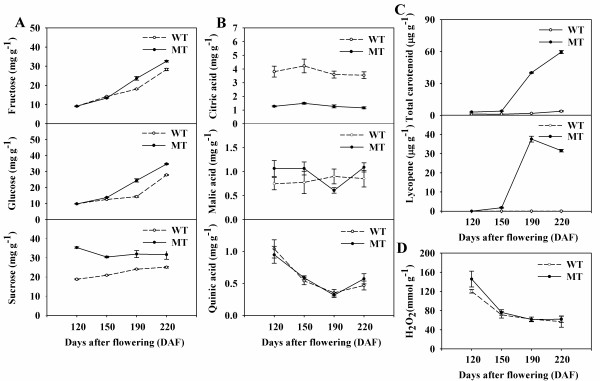
Background: The transcriptome of the fruit pulp of the sweet orange variety Anliu (WT) and that of its red fleshed mutant Hong Anliu (MT) were compared to understand the dynamics and differential expression of genes expressed during fruit development and ripening.

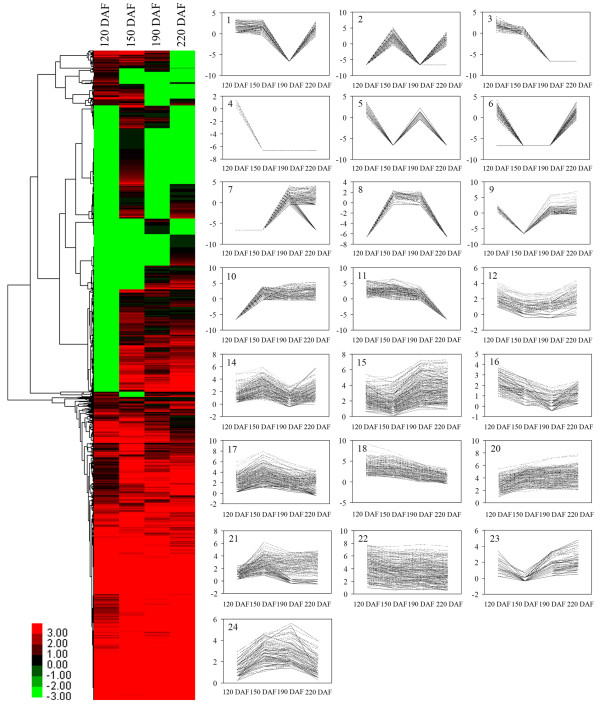
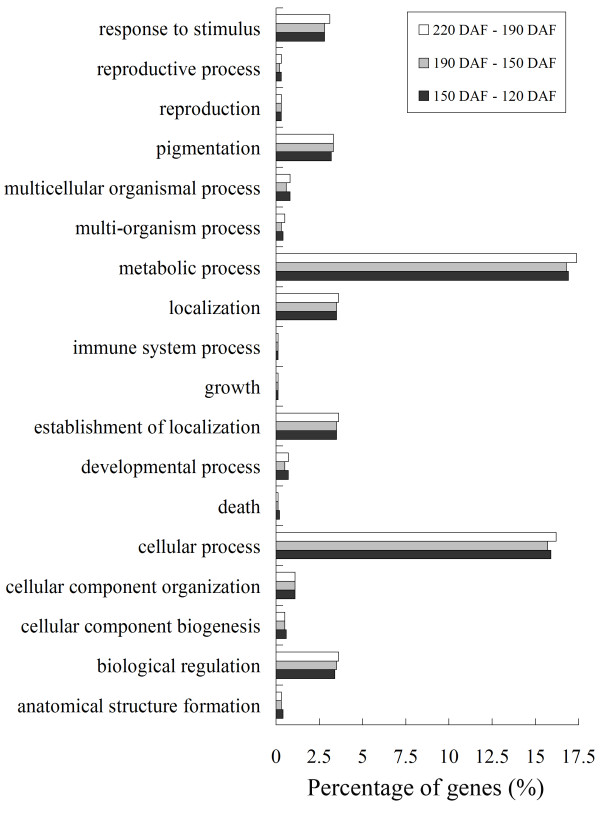
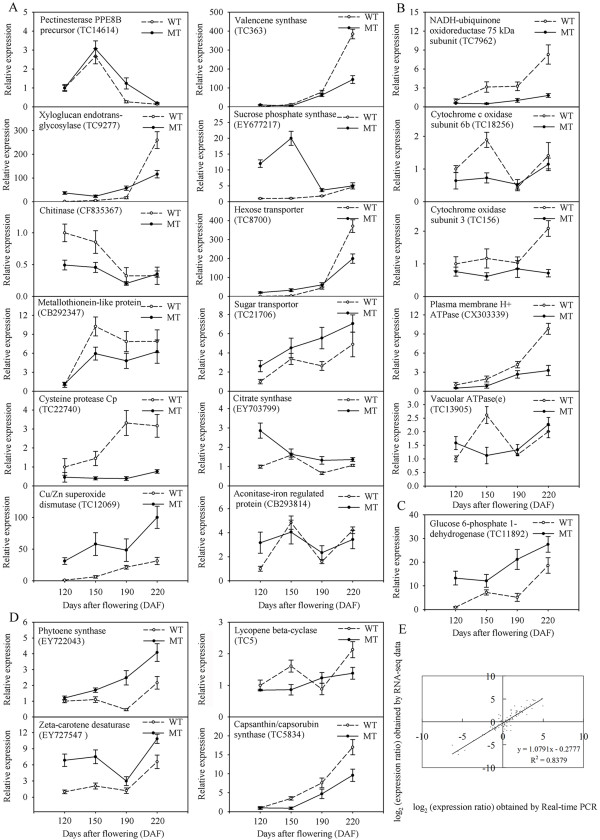
Results: The transcriptomes of WT and MT were sampled at four developmental stages using an Illumina sequencing platform. A total of 19,440 and 18,829 genes were detected in MT and WT, respectively. Hierarchical clustering analysis revealed 24 expression patterns for the set of all genes detected, of which 20 were in common between MT and WT. Over 89% of the genes showed differential expression during fruit development and ripening in the WT. Functional categorization of the differentially expressed genes revealed that cell wall biosynthesis, carbohydrate and citric acid metabolism, carotenoid metabolism, and the response to stress were the most differentially regulated processes occurring during fruit development and ripening.

Conclusion: A description of the transcriptomic changes occurring during fruit development and ripening was obtained in sweet orange, along with a dynamic view of the gene expression differences between the wild type and a red fleshed mutant.


Figures

Figure 1
Figure 1
RNA-seq based transcriptome dynamics of 'Anliu' sweet orange during fruit development and ripening. The log2 of transcripts per million (TPM) for each gene was used for the hierarchical clustering analysis at each of the four selected developmental stages (120, 150, 190 and 220 DAF). The 18,829 genes were classified into 22 regulation patterns (groups 1-12, 14-18, and 20-24). The designation was based on the nomenclature of the gene expression pattern in MT (additional file 6). The gene expression patterns of groups 13 and 19 from MT were absent in WT while two additional patterns, designated as groups 23 and 24, were exclusively present in WT. DAF, days after flowering.
Figure 2
Figure 2
Functional categorization of genes differentially expressed during fruit development and ripening in 'Anliu' sweet orange based on biological process of Gene Ontology. The differences between 120 and 150 DAF are indicated by black squares. The differences between 150 and 190 DAF are indicated by light grey squares. The differences between 190 and 220 DAF are indicated by white squares. Percentages are based on the proportion of the number of genes in each set.
Figure 3
Figure 3
Distribution of genes differentially expressed between 'Anliu' sweet orange and its red flesh mutant at each of four selected stages of fruit development and ripening. The number of up-regulated genes was less than that of down-regulated ones at all the four stages. WT120 vs MT120 indicates a comparison between WT and MT at 120 DAF.
Figure 4
Figure 4
qRT-PCR validation of differential expression. The figure shows transcript levels of 22 genes, of which 12 probably associated with fruit development and ripening (A) and 10 with oxidative phosphorylation (B), the OPP pathway (C) or carotenoid biosynthesis (D) in MT (solid line) and WT (broken line). The y-axis records the relative gene expression levels analyzed by qRT-PCR. Bars represent the standard error (n = 3). (E) A comparison between the gene expression ratios obtained from RNA-seq data and qRT-PCR. The RNA-seq log2 of expression ratio (y-axis) have been plotted against developmental stages (x-axis).
Figure 5
Figure 5
Dynamics of soluble sugar, organic acid, total carotenoid, lycopene and H2O2 accumulation during fruit development and ripening . The concentrations of soluble sugars (A) and organic acids (B) were determined by GC. The total carotenoid and lycopene (C) contents have been published previously [20]. The H2O2 content (D) was determined by spectrophotometer at 450 nm. 'Anliu' sweet orange (WT, broken line) and its red flesh mutant (MT, solid line) fruits at each of four selected developmental stages were used in the analysis. Bars represent the standard error (n = 3). DAF, days after flowering.

References

    1. Coombe BG. The Development of Fleshy Fruits. Annu Rev Plant Physiol. 1976;27:207–228. doi: 10.1146/annurev.pp.27.060176.001231. - DOI
    1. Fei ZJ, Tang XM, Alba RM, White JA, Ronning CM, Martin GB, Tanksley SD, Giovannoni JJ. Comprehensive EST analysis of tomato and comparative genomics of fruit ripening. Plant J. 2004;40(1):47–59. doi: 10.1111/j.1365-313X.2004.02188.x. - DOI - PubMed
    1. Iglesias DJ, Cercós M, Colmenero-Flores JM, Naranjo MA, Ríos G, Carrera E, Ruiz-Rivero O, Lliso I, Morillon R, Tadeo FR, Talon M. Physiology of citrus fruiting. Braz J Plant Physiol. 2007;19:333–362.
    1. Bain JM. Morphological, anatomical, and physiological changes in the developing fruit of the Valencia orange, Citrus sinensis (L) Osbeck. Aust J Bot. 1958;6(1):1–23. doi: 10.1071/BT9580001. - DOI
    1. Mohammad A, Shangwu C, Yechun W, Oliver Y, Laszlo K, Wenping Q. Berry skin development in Norton grape: Distinct patterns of transcriptional regulation and flavonoid biosynthesis. BMC Plant Biol. 2011;11:7. doi: 10.1186/1471-2229-11-7. - DOI - PMC - PubMed

Publication types