. 2012 Mar 1;18(5):1268-80.
doi: 10.1158/1078-0432.CCR-11-1795. Epub 2012 Jan 9.

Telomestatin impairs glioma stem cell survival and growth through the disruption of telomeric G-quadruplex and inhibition of the proto-oncogene, c-Myb

Affiliations

Telomestatin impairs glioma stem cell survival and growth through the disruption of telomeric G-quadruplex and inhibition of the proto-oncogene, c-Myb

Takeshi Miyazaki et al. Clin Cancer Res. .

Abstract

Purpose: Glioma stem cells (GSC) are a critical therapeutic target of glioblastoma multiforme (GBM).

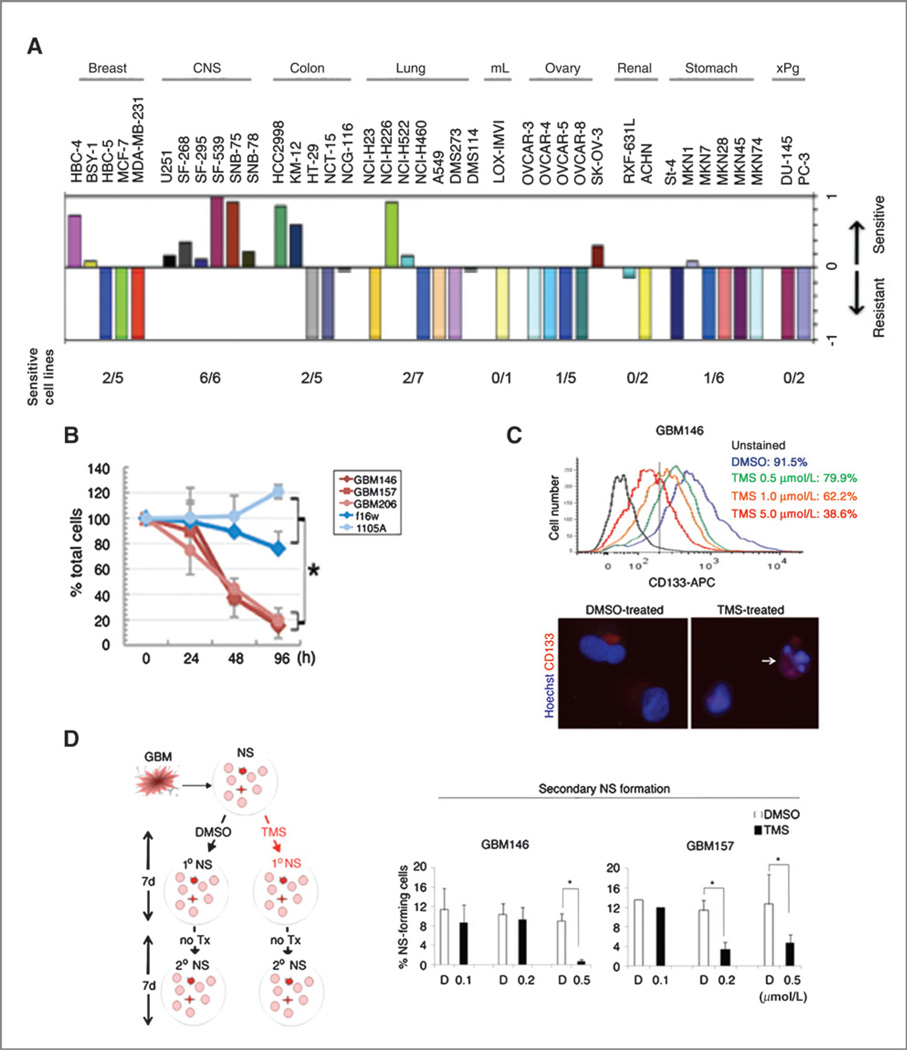
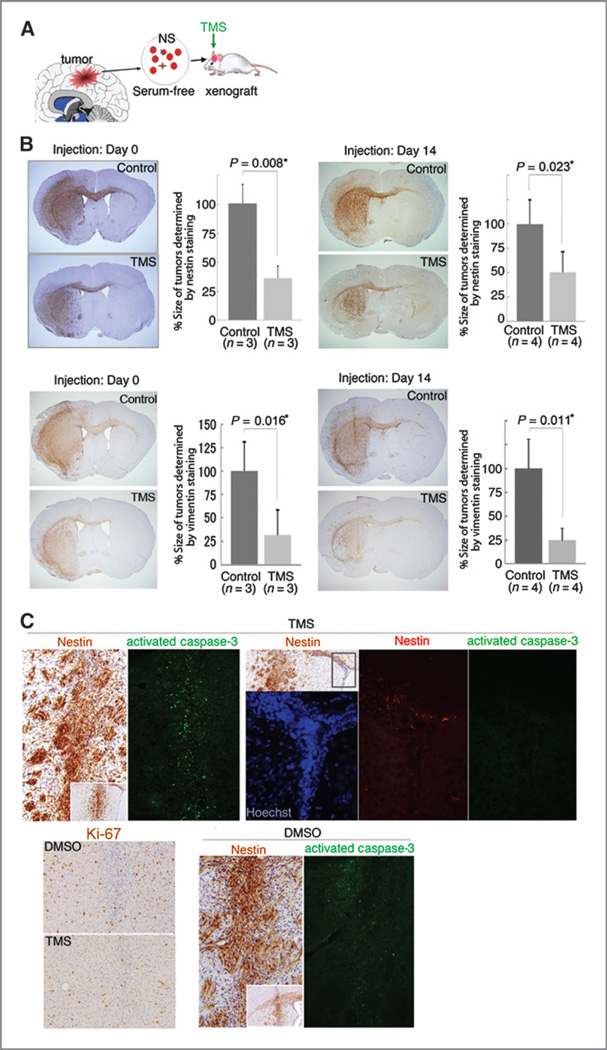
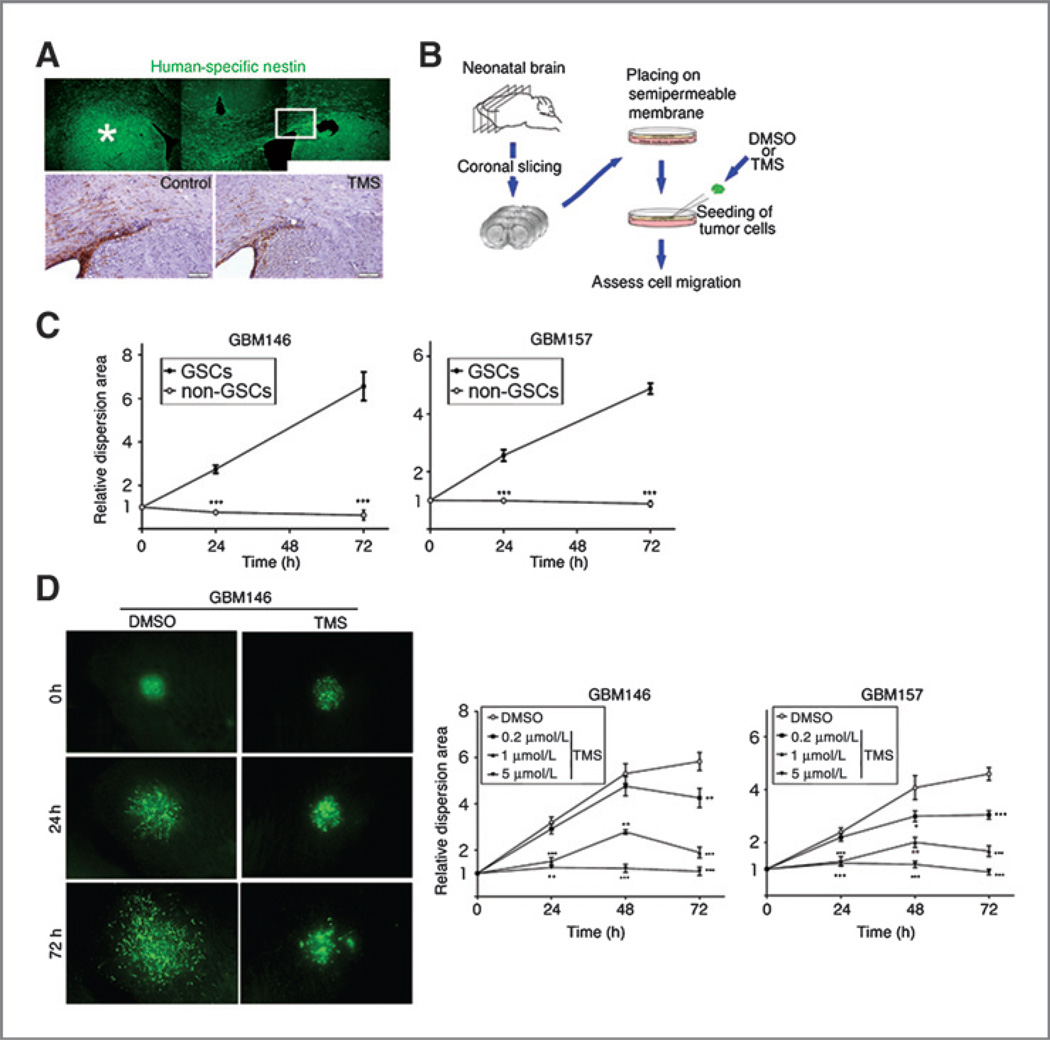
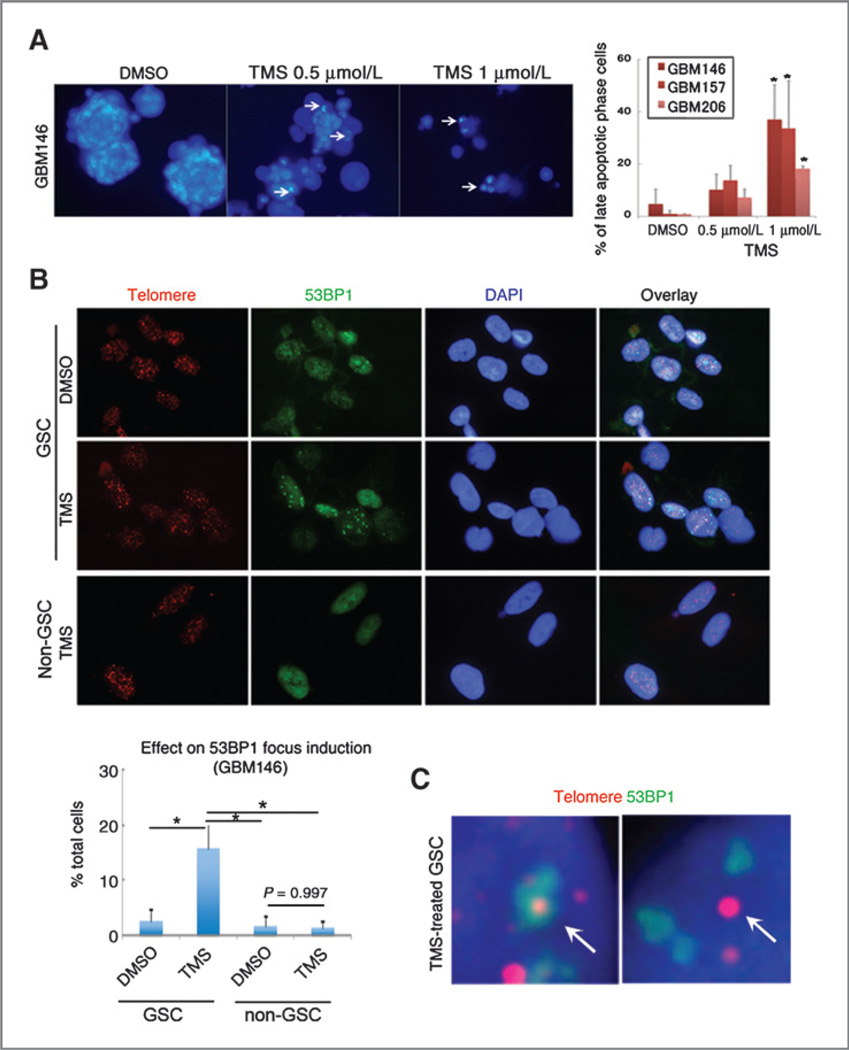
Experimental design: The effects of a G-quadruplex ligand, telomestatin, were evaluated using patient-derived GSCs, non-stem tumor cells (non-GSC), and normal fetal neural precursors in vitro and in vivo. The molecular targets of telomestatin were determined by immunofluorescence in situ hybridization (iFISH) and cDNA microarray. The data were then validated by in vitro and in vivo functional assays, as well as by immunohistochemistry against 90 clinical samples.

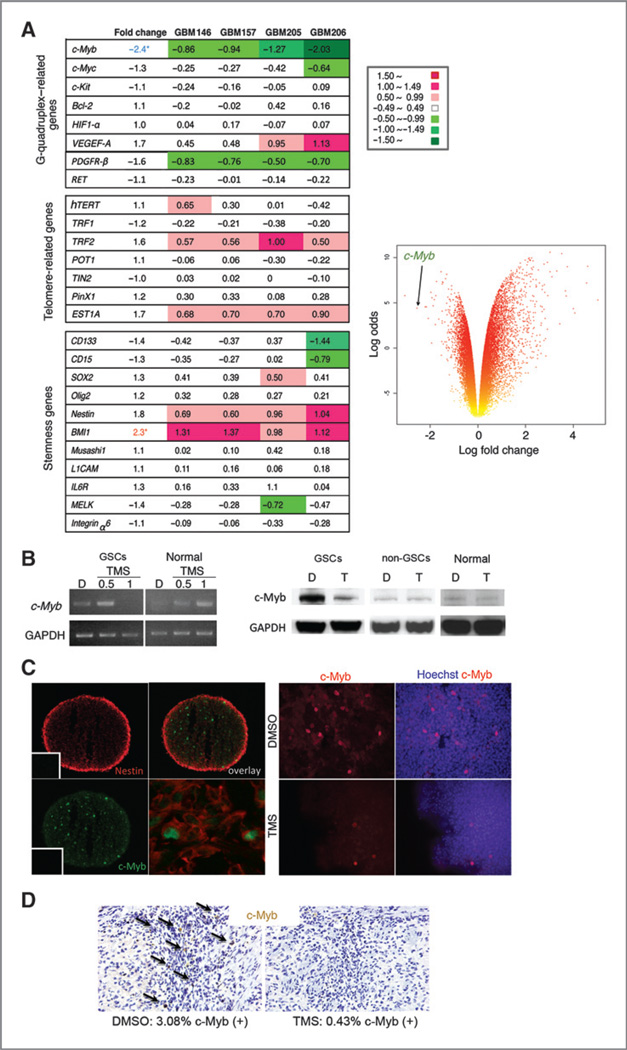
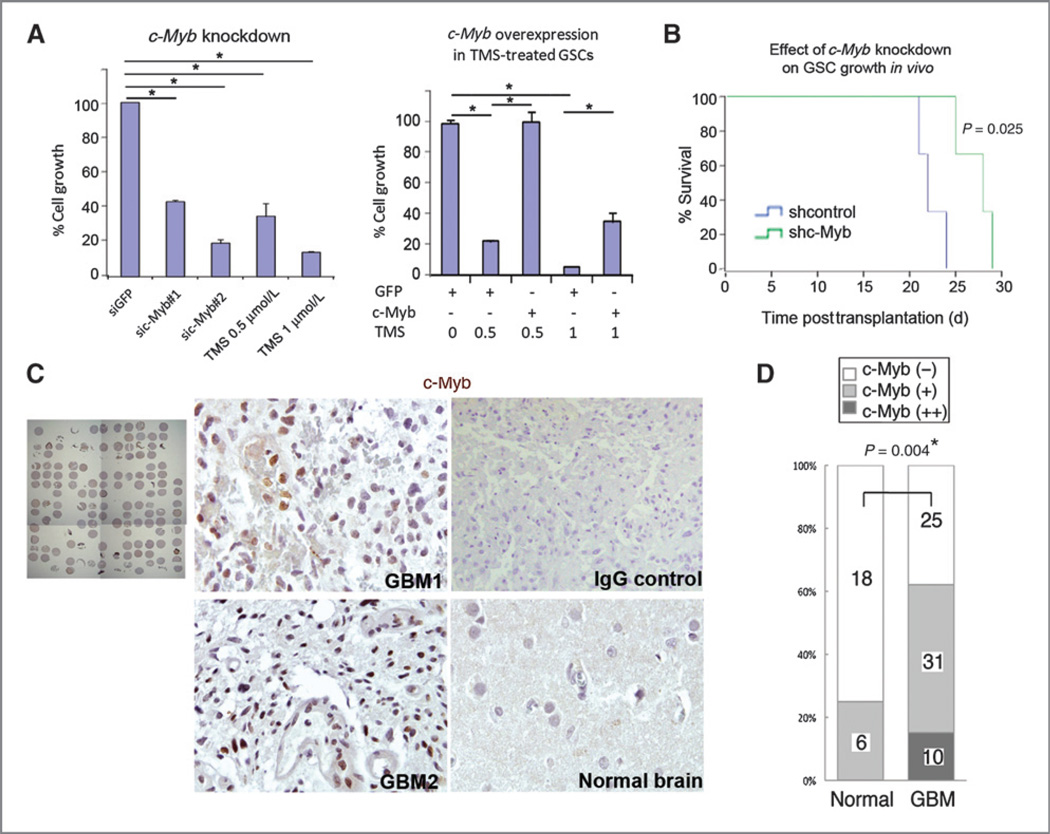
Results: Telomestatin impaired the maintenance of GSC stem cell state by inducing apoptosis in vitro and in vivo. The migration potential of GSCs was also impaired by telomestatin treatment. In contrast, both normal neural precursors and non-GSCs were relatively resistant to telomestatin. Treatment of GSC-derived mouse intracranial tumors reduced tumor sizes in vivo without a noticeable cell death in normal brains. iFISH revealed both telomeric and non-telomeric DNA damage by telomestatin in GSCs but not in non-GSCs. cDNA microarray identified a proto-oncogene, c-Myb, as a novel molecular target of telomestatin in GSCs, and pharmacodynamic analysis in telomestatin-treated tumor-bearing mouse brains showed a reduction of c-Myb in tumors in vivo. Knockdown of c-Myb phenocopied telomestatin-treated GSCs both in vitro and in vivo, and restoring c-Myb by overexpression partially rescued the phenotype. Finally, c-Myb expression was markedly elevated in surgical specimens of GBMs compared with normal tissues.

Conclusions: These data indicate that telomestatin potently eradicates GSCs through telomere disruption and c-Myb inhibition, and this study suggests a novel GSC-directed therapeutic strategy for GBMs.


Conflict of interest statement

Disclosure of Potential Conflicts of Interest

All authors have seen and approved the manuscript. No potential conflicts of interest were disclosed.

Figures

Figure 1
Figure 1
Growth inhibition activity of telomestatin against GSCs. A, sensitivity of 39 cancer cell lines to telomestatin for 48 hours. A panel of 39 human cancer cell lines (termed JFCR39) was previously described (23). Values below zero indicate resistance to telomestatin, and values above zero indicate sensitivity. Negative (−) 1 indicates that the treatment with highest dose of telomestatin did not reach less than 50% decrease in cell number. B, time course of relative cell numbers of 3 GSC and 2 normal neural precursors at 1 µmol/L of telomestatin. *, statistical significance by two-sided t test (P = 0.00049). C, histograms indicating the proportions of CD133-positive cells in GBM146 spheres after treatment with varying doses of telomestatin for 48 hours (top). Immunocytochemistry of GBM146 sphere cells stained with CD133 (red) after treatment with or without 1 µmol/L of telomestatin (TMS) for 48 hours (bottom). Hoechst dye was used for nuclear staining. The arrow indicates a CD133-positive cell with condensed fragmentation of nuclei. Original magnification, 40×. D, experimental flow (left). Graphs (right) indicate the proportions of sphere-forming cells derived from telomestatin (TMS)-pretreated 2 GBM samples (GBM146 and 157). APC, allophycocyanin; D, DMSO; mL, melanoma; NS, neurospheres. *, statistical significance by two-sided t test (P < 0.05).
Figure 2
Figure 2
Reduction of GSC-derived tumor sizes with intratumoral telomestatin (TMS) injection. A, experimental flow: telomestatin was injected into the tumor cavity by 2 different regimens, one with 5 pmol of telomestatin at the same time of tumor cell xenograft (day 0; left), the other with 50 pmol of telomestatin at 14 days after tumor cell xenograft (right). B, representative pictures indicate human-specific nestin staining (top) and vimentin staining (bottom) of immunocompromised mouse brains bearing GBM sphere–derived tumors with DMSO or telomestatin intratumoral injection at indicated time points. Original magnification, 2×. Graphs indicate the average of overall tumor sizes determined by immunostaining with human-specific antibody in each group. The number of mice in each group is indicated in the graph. *, statistical significance by two-sided t test. Exact P values are indicated in the figure. C, immunohistochemistry of mouse brains at 2 days following intratumoral injection of DMSO or 2.5 nmol of telomestatin with antibodies for human-specific nestin, activated caspase-3, and Ki-67. Pictures at the injection site are shown in top left 2 panels and bottom panels and pictures at the lateral ventricle are shown in top right 3 panels. Original magnification, 20×.
Figure 3
Figure 3
Inhibitory effect of telomestatin (TMS) on GSC migration. A, representative pictures of human-specific nestin staining of immunocompromised mouse brains bearing human GBM157 sphere–derived tumors (top). Original magnification, 10×. *, location of xenograft. The rectangle indicates the region of magnification in the bottom. Human-specific nestin staining indicates migrated human GBM cells to the contralateral side of mouse brains through the corpus callosum in the control (DMSO-treated) group (bottom left) and telomestatin-treated group (bottom right). Original magnification, 40×. B, experimental flow for the migration assay in organotypic cultures of mouse brain slices. C, graphs for the time course of migration of GBM spheres (GSCs) and serum-propagated cells (non-GSCs) derived from 2 GBM samples (GBM146 and 157). Quantitative analysis indicates cell dispersion (Area tx/Area t0). ***, statistical significance by 2-way ANOVA for repeated measures (P < 0.001). D, representative pictures of GFP-expressing human GBM146 cells dispersing on brain slices after treatment with 1 µmol/L of telomestatin or DMSO (left). Graphs indicate the relative dispersion of the cells normalized the initial size and fluorescence of the spheres (right). *, statistical significance by 2-way ANOVA for repeated measures (**, P < 0.05; ***, P < 0.001).
Figure 4
Figure 4
Formation of 53BP1 foci in telomeric and non-telomeric DNA in GSCs, but not non-stem tumor cells. A, representative pictures of Hoechst dye staining to detect chromatin condensations in late apoptotic cells (indicated by arrows) treated with indicated dose of telomestatin (TMS) for 96 hours (left), and the graph indicating the proportion of apoptotic cells in 3 GBM spheres (right). *, statistical significance (P < 0.05). B, iFISH analysis indicating telomeric and non-telomeric DNA damages in telomestatin-treated GBM spheres. GBM146 spheres (GSCs) or serum-propagated GBM146 cells (non-GSCs) were treated with 1 µmol/L of telomestatin in serum-free medium for 96 hours and subjected to iFISH analysis (top). Red, telomeric DNA; green, 53BP1; blue, DAPI staining for nuclear DNA. Quantitative graph of the 53BP1 focus–positive cells (bottom). GBM146 cells were classified into the focus-positive or -negative fractions according to the number of cells with punctate nuclear 53BP1 foci (n > 2). *, statistical significance (P < 0.001). C, magnified views of the representative telomere dysfunction–induced foci (arrow in left) and non-telomeric DNA damage foci (arrow in right) in GSCs derived from GBM146 treated with 1 µmol/L of telomestatin for 96 hours. DAPI, 40′, 6-diamidino-2-phenylindole.
Figure 5
Figure 5
c-Myb as a target of telomestatin (TMS) in GSCs. A, identification of distinct gene expression profiles in telomestatin-treated GSCs. The fold changes in representative candidates for indicated genes (left). Scatter plot of normalized signal intensities ofGSCs with telomestatin treatment (right). B, change of c-Myb expression level with telomestatin treatment in GBM146 spheres (GSCs), serum-propagated GBM146 cells (non-GSCs), and normal neural precursors (1105A) determined by RT-PCR and Western blot analysis D, DMSO; GAPDH, glyceraldehyde-3-phosphate dehydrogenase; T, telomestatin. C, immunocytochemistry of GBM157 spheres with c-Myb and human-specific nestin antibodies. Hoechst is used for nuclear staining. Insets indicate staining results without the primary antibodies. Original magnification, 20×. D, pharmacodynamic analysis of telomestatin or DMSO on c-Myb expression in GBM157 sphere–derived tumors in mouse brains. Two days postinjection of telomestatin (2.5 nmol), brains were stained with c-Myb antibody and counterstained with hematoxylin. Arrows indicate c-Myb–positive cells at the injection site. The proportions of c-Myb–positive cells in total cells per field are indicated at the bottom.
Figure 6
Figure 6
c-Myb is essential for GSC growth and its expression is elevated in surgical specimens of GBMs. A, right graph indicates the relative cell numbers of GBM157 spheres at day 7 posttransfection with indicated siRNA constructs. Left graph indicates the relative cell numbers of GBM157 spheres at day 7 posttransfection with indicated vectors with or without telomestatin (TMS) treatment (*, P < 0.001). B, Kaplan–Meier curves indicating proportion of live mice harboring intracranial tumors derived from GBM13 spheres infected with short hairpin RNA (shRNA) lentivirus for c-Myb (shc-Myb) or non-targeting sequence (shcontrol). C, a single slide with 66 GBM specimens and 24 normal brain tissues stained with c-Myb antibody (left). Representative staining results with 2 GBM tissues and one normal brain is shown (brown in middle). IgG control shows the background staining intensity. D, graph indicates the proportion of c-Myb strongly positive (++), weakly positive (+), and negative (−) samples in normal brain tissues (n = 24) and GBM tissues (n = 66; P = 0.004).

Similar articles

Cited by

References

    1. Vescovi AL, Galli R, Reynolds BA. Brain tumour stem cells. Nat Rev Cancer. 2006;6:425–436. - PubMed
    1. Cheng L, Bao S, Rich JN. Potential therapeutic implications of cancer stem cells in glioblastoma. Biochem Pharmacol. 2010;80:654–665. - PMC - PubMed
    1. Kim MY, Vankayalapati H, Shin-Ya K, Wierzba K, Hurley LH. Telomestatin, a potent telomerase inhibitor that interacts quite specifically with the human telomeric intramolecular g-quadruplex. J Am Chem Soc. 2002;124:2098–2099. - PubMed
    1. d'Adda di Fagagna F, Reaper PM, Clay-Farrace L, Fiegler H, Carr P, Von Zglinicki T, et al. A DNA damage checkpoint response in telomere-initiated senescence. Nature. 2003;426:194–198. - PubMed
    1. Counter CM, Avilion AA, LeFeuvre CE, Stewart NG, Greider CW, Harley CB, et al. Telomere shortening associated with chromosome instability is arrested in immortal cells which express telomerase activity. EMBO J. 1992;11:1921–1929. - PMC - PubMed

Publication types

MeSH terms