. 2012 Feb 14;14(6):1892-906.
doi: 10.1039/c1cp20839j. Epub 2012 Jan 9.

Role of spatial ionic distribution on the energetics of hydrophobic assembly and properties of the water/hydrophobe interface

Affiliations

Role of spatial ionic distribution on the energetics of hydrophobic assembly and properties of the water/hydrophobe interface

Brad A Bauer et al. Phys Chem Chem Phys. .

Abstract

We present results from all-atom molecular dynamics simulations of large-scale hydrophobic plates solvated in NaCl and NaI salt solutions. As observed in studies of ions at the air-water interface, the density of iodide near the water-plate interface is significantly enhanced relative to chloride and in the bulk. This allows for the partial hydration of iodide while chloride remains more fully hydrated. In 1 M solutions, iodide directly pushes the hydrophobes together (contributing -2.51 kcal mol(-1)) to the PMF. Chloride, however, strengthens the water-induced contribution to the PMF by ~-2.84 kcal mol(-1). These observations are enhanced in 3 M solutions, consistent with the increased ion density in the vicinity of the hydrophobes. The different salt solutions influence changes in the critical hydrophobe separation distance and characteristic wetting/dewetting transitions. These differences are largely influenced by the ion-specific expulsion of iodide from bulk water. Results of this study are of general interest to the study of ions at interfaces and may lend insight to the mechanisms underlying the Hofmeister series.


Figures
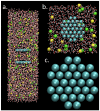
Fig. 1
Fig. 1
Representative snapshots of the 1M NaCl system used in this study; plate-plate separation is 14.4 Å. Atom types can be distinguished by the following color code: O (red), H (white), Cl (green), Na+ (yellow), plate atoms (blue). (a) Side profile showing the relative solvation of the plates in the normal and lateral directions. Solvent occupies a significant volume, with at least 25 Å between plate-water and water-air interfaces. (b) Top profile of a solvated plate. For clarity only particles occupying 0 < z < 12Å are shown; the size of water molecule representations was also reduced. Distance between plates and their lateral periodic image is sufficient to allow access to several layers of water and ions. (c) Unsolvated plate, depicting the fixed geometry of 31 uncharged plate atoms.
Fig. 2
Fig. 2
Number density and number profiles for different species in pure water, 1M NaCl, and 1M NaI solutions as a function of distance from the plate (approaching the bulk region). Density profiles for (a) water, (b) anions, and (c) cations. Corresponding integrated profiles are shown in panels d-f, respectively. The inset of panel a shows a focused view of the first density peak. The insets of panel B demonstrate the initial deviation in the NaI profile from the NaCl and pure water (left) and the deviation of the NaCl from water at larger distances (right).
Fig. 3
Fig. 3
Density profiles for (a) NaCl 1M, (b) NaI 1M, (c) NaCl 3M, (d) NaI 3M at hydrophobe-water and liquid-vapor interface. The interplate distance is 10.6 Å in all cases. The density of water has been rescaled with the ratio of the number of anion and the number of water.
Fig. 4
Fig. 4
Density profiles for (a) water, (b) anions, and (c) cations in pure water, 3M NaCl, 3M NaI solutions. Corresponding integrated number density profiles are shown in panels d-f, respectively. For ion profiles, we show prediction from 3 times the 1M profiles (dotted profiles).
Fig. 5
Fig. 5
Radial-angular distribution function (RADF) between anions with the water hydrogen atoms (a)(d) near the hydrophobe-water surface, (b)(e) bulk, and (c)(f) the liquid-vapor interface. The angle (θ) is defined between the anion-hydrogen vector and the positive z-axis.
Fig. 6
Fig. 6
Analysis of anisotropy of ion hydration in bulk TIP4P-FQ, water-plate interface, and liquid-vapor interface. The projection of the center of mass of the closest n water molecules in a local coordinate frame is shown as a function of n. Non-zero values for this projection suggest anisotropic hydration of the ion, while values of zero indicate isotropic ion hydration.
Fig. 7
Fig. 7
Radial angular distribution function (RADF) of anions with (a)(d) the closest hydrogen atom of neighboring, (b)(e) the water oxygen atom, and (c)(f) the farthest hydrogen atom in neighboring water.
Fig. 8
Fig. 8
Schematic of hydration structure of (a) chloride and (b) iodide near the plate. Iodide is able to more closely approach the plates than the chloride, which maintains more of its solvation shell.
Fig. 9
Fig. 9
Potential of mean force for plate association in pure TIP4P-FQ, 1M NaCl, 1M NaI, 3M NaCl, and 3M NaI solutions. Inset shows the minimum region of the profiles.
Fig. 10
Fig. 10
Decomposition of potential of mean force for plate association in 1M salt solution and pure TIP4P-FQ. The left panel includes the total PMF, the water contribution, and the contribution arising from the plates. The right panel consists of the anion and cation contributions.
Fig. 11
Fig. 11
Decomposition of potential of mean force for plate association in 3M salt solution and pure TIP4P-FQ. The left panel includes the total PMF, the water contribution, and the contribution arising from the plates. The right panel consists of the anion and cation contributions as calculated from 3M solutions. Predicted contributions from each ion determined by scaling the 1M solution results by a factor of 3 are also shown in panel b.
Fig. 12
Fig. 12
Salt solutions under hydrophobic confinement. The number of water molecules confined between the plates as a function of plate separation distance are shown in Panels a and b for 1M and 3M salt solutions, respectively. Analogous profiles showing the number of each ion are shown in Panels c and d for 1M and 3M salt solutions. A sharp increase in the number of confined molecules (z = 10 − 11 Å) indicates the critical region for wetting/dewetting transitions.
Fig. 13
Fig. 13
Free energetics of wetting/dewetting the region between the plates. Free energy is calculated from the probability of finding a given number of water molecules between the plates at a specified separation distance. Results are shown for (a) pure TIP4P-FQ, (b) 1M NaCl, (c) 3M NaCl, (d) 1M NaI, (e) 3M NaI. All profiles are shown relative to the free energy of the most favorable unfilled state.
Fig. 14
Fig. 14
Potential of mean force for water entering the plates as a function of their radial distance from the center of the hydrophobically confined region (x = y = 0 Å). Sampling was limited in the z-dimension to ± (d/2 − 3.6) which ensures only solvent accessible volume is considered. The PMF for d = 7.4Å (near the separation distance in which water can first enter the confined region) through d = 14.4Å (the largest separation distance sampled) are shown for water in the pure water, 1M NaCl, and 1M NaI solutions. All profiles are relative to the bulk region, which we take as the average from r = 17.0 − 18.0Å.
Fig. 15
Fig. 15
Potential of mean force calculated for Cl (black) and I (red) in 1M salt solutions as a function of radial distance from the center of the hydrophobically confined region. All profiles are shown relative to the PMF in the bulk region furthest from the confined region (the average value from r = 17.0 − 18.0Å).

Similar articles

Cited by

References

    1. Frolov AI, Rozhin AG, Fedorov MV. Chem. Phys. Chem. 2010;11:2612–2616. - PubMed
    1. Lin S, Blankschtein D. J. Phys. Chem. B. 2010;2010:15616–15625. - PubMed
    1. Zelada-Guillen GA, Riu J, Duzgun A, Rius FX. Angew. Chem. Int. Ed. 2009;48:7334–7337. - PubMed
    1. Zelada-Guillen GA, Riu J, Duzgun A, Rius FX. Angew. Chem. 2009;121:7470–7473. - PubMed
    1. Chen RJ, Bangsaruntip S, Drouvalakis KA, Kam NWS, Shim M, Li Y, Kim W, Utz PJ, Dai H. Proc. Nat. Aca. Sci. 2003;100:4984–4989. - PMC - PubMed

Publication types