. 2012 Jan 8;15(3):470-6, S1-3.
doi: 10.1038/nn.3017.

Mechanisms underlying cortical activity during value-guided choice

Affiliations

Mechanisms underlying cortical activity during value-guided choice

Laurence T Hunt et al. Nat Neurosci. .

Abstract

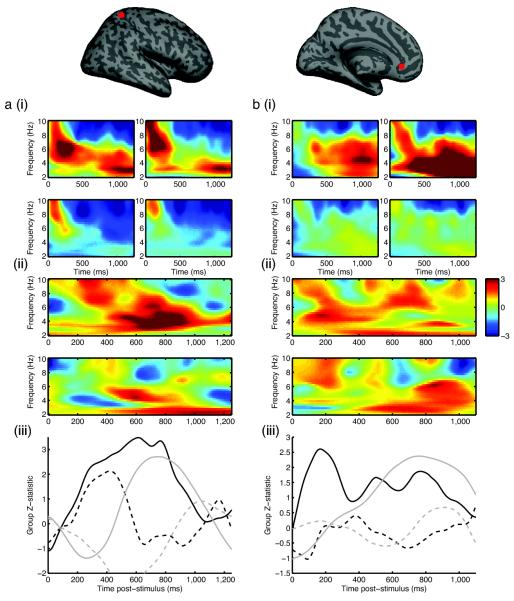
When choosing between two options, correlates of their value are represented in neural activity throughout the brain. Whether these representations reflect activity that is fundamental to the computational process of value comparison, as opposed to other computations covarying with value, is unknown. We investigated activity in a biophysically plausible network model that transforms inputs relating to value into categorical choices. A set of characteristic time-varying signals emerged that reflect value comparison. We tested these model predictions using magnetoencephalography data recorded from human subjects performing value-guided decisions. Parietal and prefrontal signals matched closely with model predictions. These results provide a mechanistic explanation of neural signals recorded during value-guided choice and a means of distinguishing computational roles of different cortical regions whose activity covaries with value.


Figures

Figure 1
Figure 1. Predictions of neural activity from cortical attractor network model
(A) Top panel: summed network postsynaptic currents as a function of time through trial, sorted and binned into trials with high overall value (lighter shades of grey) through trials with low overall value (dark grey/black). Bottom panel: As top panel, resorted and binned by value difference between chosen and unchosen options. (B) Effect of value difference (VD), overall value (OV) and ‘no brainer’ (NB) trials on reaction time, estimated using multiple regression (mean +/− s.e. of effect size; Y-axis is flipped, so positive values equate to a negative effect on reaction times). (C) Time-frequency spectra of effects of overall value (top panel) and value difference (bottom panel) on network model activity, estimated with multiple regression. Color indicates Z-statistic. (D) Z-scored effect of overall value (on frequency range 3–9Hz; black lines) and value difference (on frequency range 2–4.5 Hz; grey lines); solid lines are correct trials, dashed lines incorrect trials.
Figure 2
Figure 2. Value-based decision task
Task schematic. Subjects repeatedly chose between two risky prospects to obtain monetary reward. Stimuli comprised a rectangular bar, whose width determined the amount of reward available, and a number presented underneath the bar, whose value determined the probability of receiving reward on that option. Stimuli were drawn such that reward magnitude/probability were never identical across the two options; subjects therefore needed to integrate across stimulus dimensions to make optimal choices. On some trials, however, both probability and magnitude were larger on one side than the other – a ‘no brainer’ trial. Subjects had unlimited time to respond, and received feedback on both chosen and unchosen options – green for rewarded option, red for non-rewarded.
Figure 3
Figure 3. Subject behavior
(A) Reaction time (mean +/− s.e.) for an example subject, as a function of subjective value difference (black) and subjective overall value (red). (B) Effects of value difference (VD), overall value (OV) and ‘no brainer trials’ (NB) on subject reaction times (mean +/− s.e. across subjects), estimated using linear regression. Y-axis is flipped; positive values equate to a negative effect on reaction times. (C) Running group mean +/− s.e. of reaction time (smoothed across 40 trials) as a function of trial number. See also supplementary figures S1/S2.
Figure 4
Figure 4. Main effect of task performance on activity in 2–10Hz frequency range
(A)/(B) Stimulus locked activity. Group T-map of effect of task performance relative to a −300 to −100 ms (pre-stimulus) baseline; (A) 100ms post-stimulus, early visual activation (peak T(29)=10.00, 100ms, MNI (40,−74,6)); (B) 1000ms post-stimulus, activation at frontal pole (T(29)=7.23, 1125ms, MNI (22,58,26) and ventromedial prefrontal cortex (T(29)=5.20, 1000ms, MNI (43,60,35)). (C)–(F) Response locked activity. Effect of task performance relative to a +100ms to +300ms (post-response) baseline; (C) 1400ms pre-response, activation at pSPL/posterior cingulate (T(29)=7.05, −1625ms (pre-response), MNI(18,−44,62) and mid-IPS (T(29)=8.20, −525ms, MNI(30,−46,56) (right) and T(29)=7.55,−700ms, MNI (−24,−42,74) (left)); (D) 850ms pre-response, activation at angular/supramarginal gyri (T(29)=8.46, −725ms, MNI (56,−50,40) (right) and T(29)=8.69, −725ms, MNI (−50,−60,42) (left)); (E) 500ms pre-response, premotor activation (T(29)=7.35,−450 ms, MNI (38,−2,64); (F) time of response, activation at inferior frontal sulci (T(29)=8.02, 0ms, MNI (−54, 12, 28) (left) and T(29)=7.55, −75ms, MNI (48,10,30) (right)) and sensorimotor cortices (T(29)=7.57, −75ms, MNI (−50,−28,58) (left) and T(29)=8.02, 0ms, MNI (−54,12,28) (right). All images are thresholded at T>4.75 (p<5*10−5 uncorrected) for display purposes. See also supplementary movies S1 and S2.
Figure 5
Figure 5. pSPL (MNI 18, −44, 62mm) and VMPFC (MNI 6, 28, −8 mm) shows several value-related hallmarks of the biophysical network model
(A)(i) pSPL: Main effect of task performance relative to pre-stimulus baseline on first half of trials (top left panel) and second half of trials (bottom left panel); main effect of task performance on trials where reward magnitude and probability advocate opposing choices (top right panel), and ‘no brainer’ trials (bottom right panel). Color indicates group Z-statistic. (ii) Time-frequency spectra of effects of overall value (top panel) and value difference (bottom panel) on activity in pSPL, estimated using multiple regression. Analysis is equivalent to that performed in figure 1C on biophysical model. Color indicates group Z-statistic. (iii) Effect of overall value (3–9Hz, black) and value difference (2–4.5 Hz, grey) on correct/error trials (solid/dashed lines respectively). (B)(i) Main effect of task in VMPFC, sorted as in figure 5A(i). (ii) VMPFC effects of overall value and value difference, as for pSPL, but restricted to first half of experiment. (iii) VMPFC collapsed value effects, as for pSPL, but restricted to first half of experiment.

Comment in

References

    1. von Neumann J, Morgenstern O. Theory of games and economic behavior. Princeton University Press; 1944.
    1. Dickinson A, Balleine B. Motivational control of goal-directed action. Animal Learning and Behavior. 1994;22:1–18.
    1. Stephens DW, Krebs JR. Foraging theory. Princeton University Press; 1986.
    1. Sutton R, Barto A. Reinforcement learning: an introduction. MIT Press; 1998.
    1. Rushworth MSF, Behrens TEJ. Choice, uncertainty and value in prefrontal and cingulate cortex. Nat Neurosci. 2008;11:389–397. doi:10.1038/nn2066. - PubMed

Publication types