. 2012 Sep 20;31(38):4182-95.
doi: 10.1038/onc.2011.584. Epub 2012 Jan 9.

Mapping the regulatory sequences controlling 93 breast cancer-associated miRNA genes leads to the identification of two functional promoters of the Hsa-mir-200b cluster, methylation of which is associated with metastasis or hormone receptor status in advanced breast cancer

Affiliations
Free PMC article

Mapping the regulatory sequences controlling 93 breast cancer-associated miRNA genes leads to the identification of two functional promoters of the Hsa-mir-200b cluster, methylation of which is associated with metastasis or hormone receptor status in advanced breast cancer

E J H Wee et al. Oncogene. .
Free PMC article

Abstract

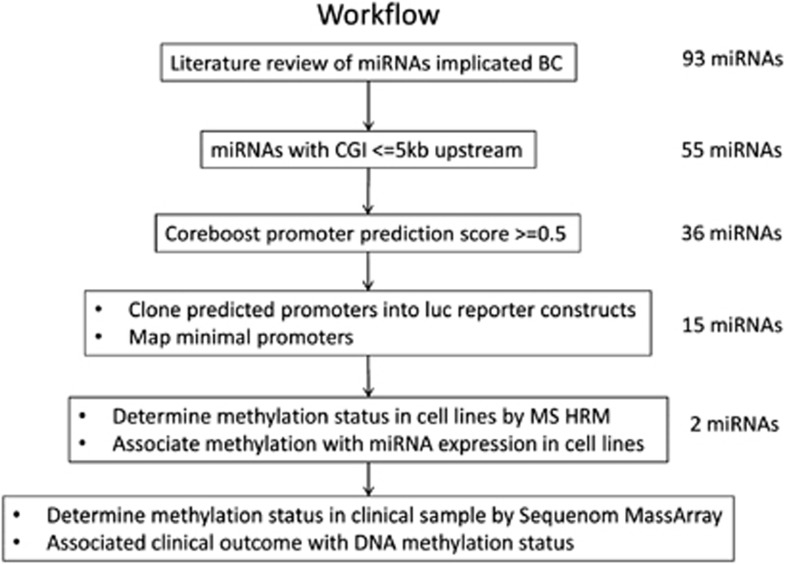
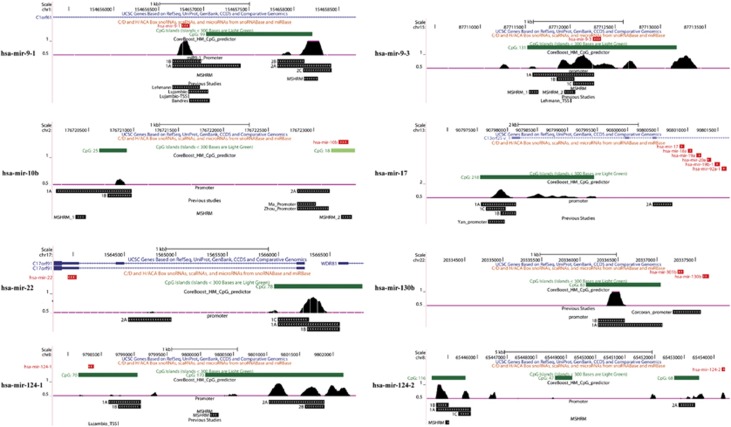
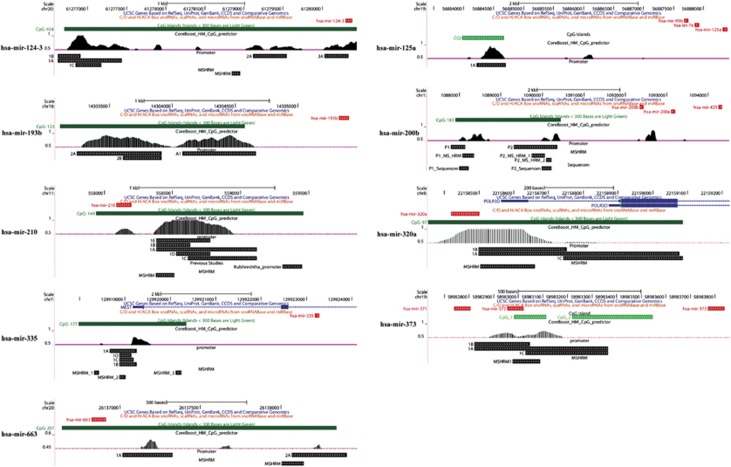
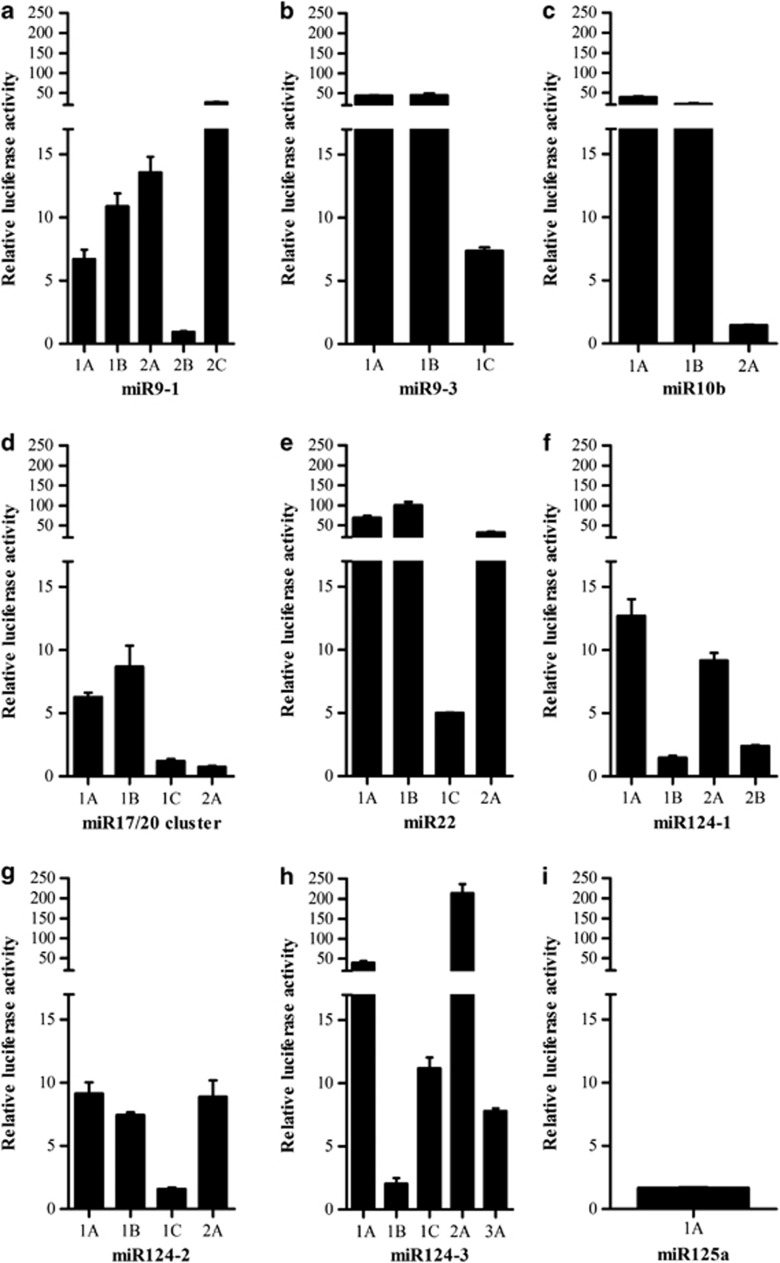
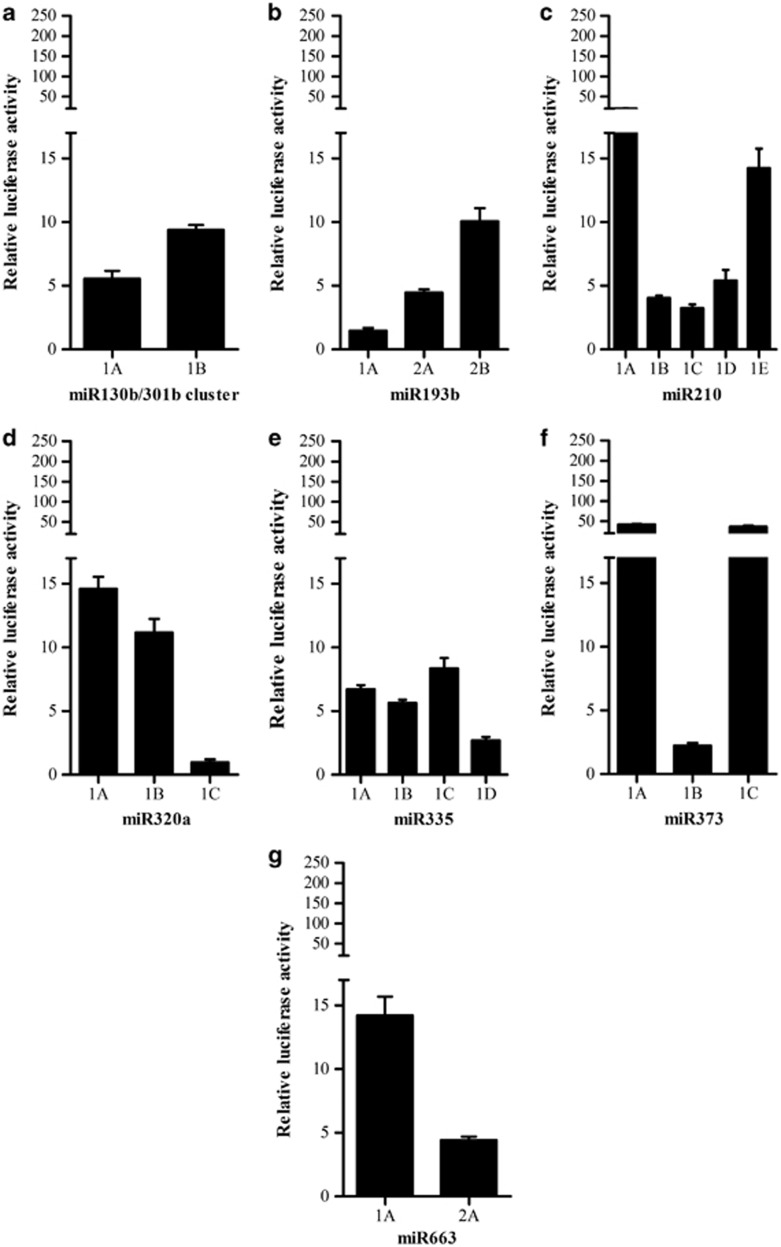
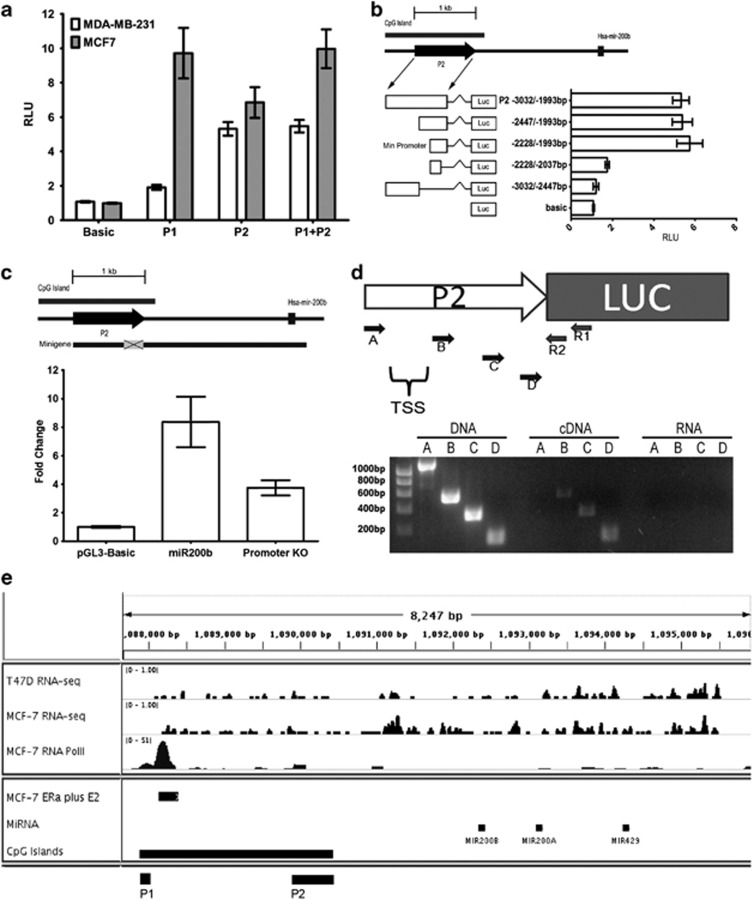
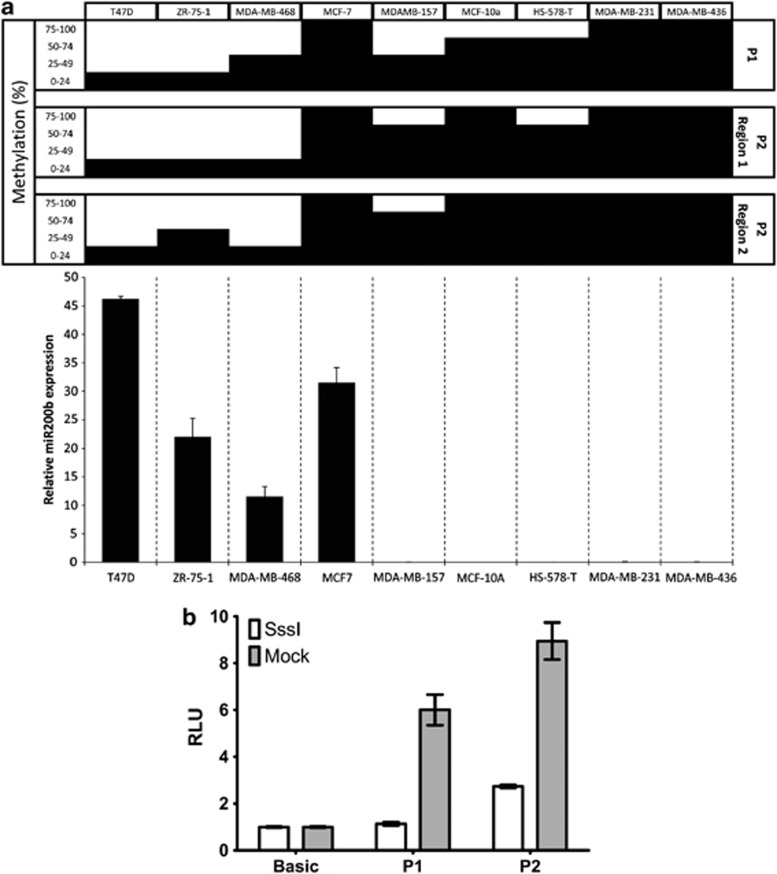
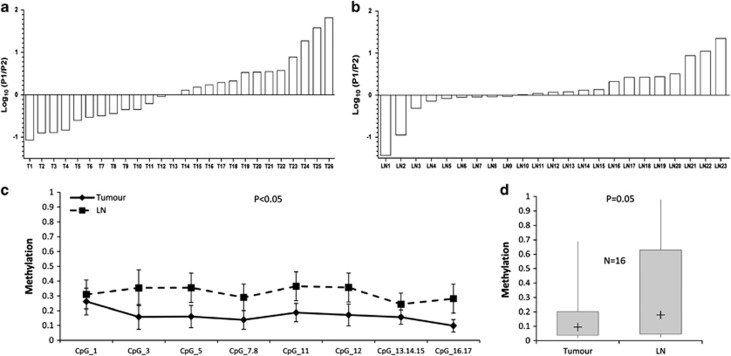
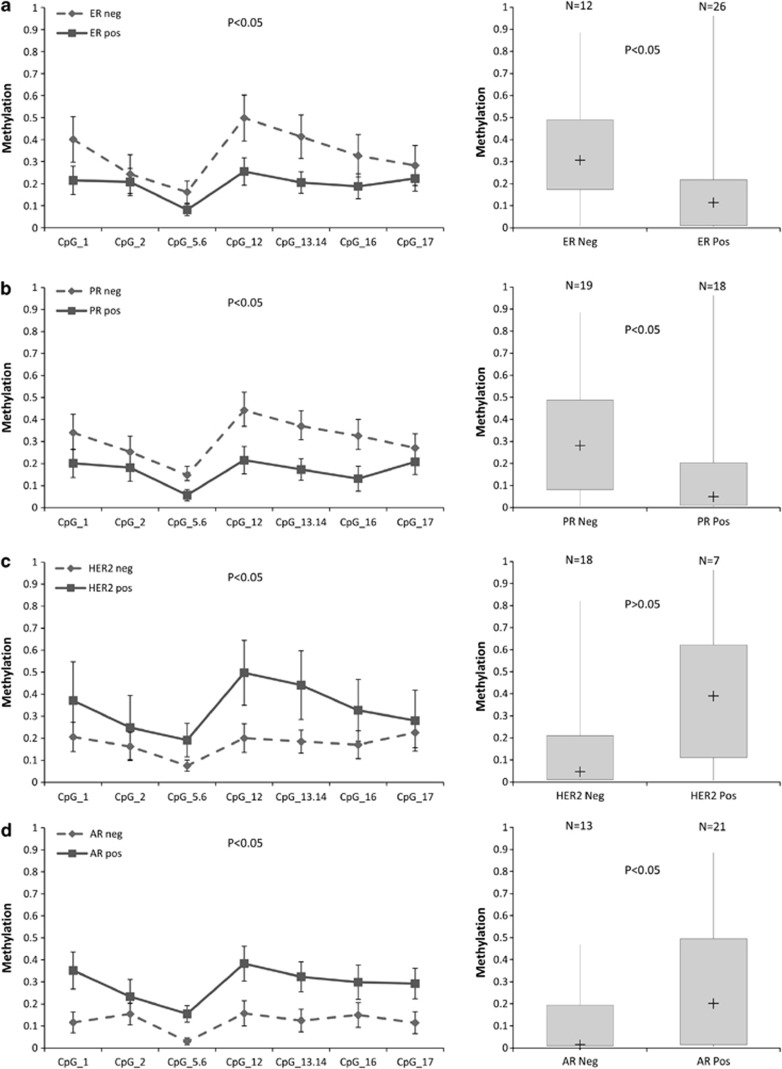
MicroRNAs (miRNAs) are small non-coding RNAs of ∼20 nt in length that are capable of modulating gene expression post-transcriptionally. Although miRNAs have been implicated in cancer, including breast cancer, the regulation of miRNA transcription and the role of defects in this process in cancer is not well understood. In this study we have mapped the promoters of 93 breast cancer-associated miRNAs, and then looked for associations between DNA methylation of 15 of these promoters and miRNA expression in breast cancer cells. The miRNA promoters with clearest association between DNA methylation and expression included a previously described and a novel promoter of the Hsa-mir-200b cluster. The novel promoter of the Hsa-mir-200b cluster, denoted P2, is located ∼2 kb upstream of the 5' stemloop and maps within a CpG island. P2 has comparable promoter activity to the previously reported promoter (P1), and is able to drive the expression of miR-200b in its endogenous genomic context. DNA methylation of both P1 and P2 was inversely associated with miR-200b expression in eight out of nine breast cancer cell lines, and in vitro methylation of both promoters repressed their activity in reporter assays. In clinical samples, P1 and P2 were differentially methylated with methylation inversely associated with miR-200b expression. P1 was hypermethylated in metastatic lymph nodes compared with matched primary breast tumours whereas P2 hypermethylation was associated with loss of either oestrogen receptor or progesterone receptor. Hypomethylation of P2 was associated with gain of HER2 and androgen receptor expression. These data suggest an association between miR-200b regulation and breast cancer subtype and a potential use of DNA methylation of miRNA promoters as a component of a suite of breast cancer biomarkers.


Figures

Figure 1
Figure 1
Overview of the miRNA selection approach performed in this study. A literature review of miRNAs implicated in breast cancer was followed by in silico and molecular studies in human breast cancer cell lines. Analysis of methylation in clinical breast cancer specimens was performed on miR-200b.
Figure 2
Figure 2
UCSC screenshots of miRNA candidates and their associated genomic features. Bars representing miRNAs are shown in red, CGIs in green, promoter and methylation-sensitive high-resolution melt analysis fragments in black. Annotated genes are marked in blue. Orientation of genes and fragments are indicated by directional arrows. CoreBoost_HM promoter predictions are shown as black peaks.
Figure 3
Figure 3
UCSC screenshots of miRNA candidates and their associated genomic features. Bars representing miRNAs are shown in red, CGIs in green, promoter and methylation-sensitive high-resolution melt analysis fragments in black. Annotated genes are marked in blue. Orientation of genes and fragments are indicated by directional arrows. CoreBoost_HM promoter predictions are shown as black peaks.
Figure 4
Figure 4
(a–i) Promoter activities of miRNA candidates. miRNA promoter activity in cells expressed in RLU±the s.e.m. Data were generated from three independent experiments. Promoter fragments are labelled 1, 2 or 3 and A, B or C indicates the sub-fragment of that respective promoter.
Figure 5
Figure 5
(a–g) Promoter activities of miRNA candidates. miRNA promoter activity in cells expressed in RLU±the s.e.m. Data were generated from three independent experiments. Promoter fragments are labelled 1, 2 or 3 and A, B or C indicates the sub-fragment of that respective promoter.
Figure 6
Figure 6
miR-200b cluster has two functional promoters. (a) Promoter activities of miR-200b P1 and P2 in MCF7 and MDA-MB-231 cells. Reporter activity is expressed in RLU±the s.e.m. Data were generated from three independent experiments. White bars represent activity in MDA-MB-231 cells whereas grey bars represent activity in MCF7 cells. (b) Luciferase activities of various miR-200b P2 5′ and 3′ truncations. Graphical representation of the various reporter fragments in relation to their genomic locations and their associated reporter activities expressed in RLU. Error bars represent s.e. of three separate experiments. (c) Top: relative location of the minigene to P2, Hsa-mir-200b and the CGI. Grey box represents the region deleted in the minigene promoter KO construct. Bottom: MDA-MB-231 cells were transfected with pGL3-basic, miR200b minigene or miR200b minigene promoter KO plasmids and assayed for mature miR-200b expression by TaqMan real-time PCR±s.e. (d) Top: schematic of the miR-200b P2 luciferase construct. The white arrow represents the P2 promoter followed by the luciferase gene. Primers R1, R2, A to D are represented small arrows. Bottom: DNA agarose gel of the 5′ PCR walk using the R2 primer with either Primer A, B, C or D, as labelled above each lane. (e) RNA-sequence profiles in T47D and MCF7 and RNA Polymerase II (RNA PolII) chip profile of MCF7 at the miR-200b locus. Peaks in RNA-sequence tracks represent expression detected at that region. Peaks represent RNA PolII binding in RNA PolII track. Horizontal bars indicate the location of the miR-200b cluster, CGI and oestrogen response element.
Figure 7
Figure 7
DNA methylation represses miR-200b P1 and P2 activity in breast cancer cells. (a) DNA methylation and miR-200b expression levels in a panel of nine breast cancer cell lines. Top: black bars represent the percentage methylation. Bottom: miR-200b expression was assessed by qPCR. Expression is shown relative to RNU6B and bars represent the mean±s.e. of two independent experiments. (b) Reporter activity of miR-200b P1 and P2 methylated by SssI DNA methylase (white) compared with mock methylated plasmids (grey)±s.d. of two separate experiments.
Figure 8
Figure 8
Differential methylation of P1 and P2 in clinical samples. (a) Log10 ratios of P1 to P2 in 26 primary tumours. (b) Log10 ratios of P1 to P2 in 23 lymph nodes (LN). Positive values: P1>P2; negative values: P1<P2. Graph heights represent magnitude of difference in methylation between P1 and P2. (c) Mean methylation profile in matched tumours and LN with horizontal s.e. bars for individual CpG units. t-Test P-value as indicated. (d) Box plot of the average methylation in tumours and LN. (+): median, box: 25–75 percentile, whiskers: max/min, N: sample size, Mann–Whitley P-values as indicated.
Figure 9
Figure 9
P2 methylation is associated with ER, PR, HER2 and AR receptor status. (a) Methylation status of ER positive (pos) and ER negative (neg) cohorts. (b) Methylation status of PR pos and PR neg cohorts. (c) Methylation status of HER2 pos and HER2 neg cohorts. (d) Methylation status of AR pos and AR neg cohorts. Left: mean methylation profile with horizontal s.e. bars for individual CpG units. t-Test P-value as indicated. Right: box plot of the average methylation in tumours and LN. (+): median, box: 25–75 percentile, whiskers: max/min, N: sample size, Mann–Whitley P-values as indicated.

Similar articles

Cited by

References

    1. Rapid amplification of 5′ complementary DNA ends (5′ RACE) Nat Methods. 2005;2:629–630. - PubMed
    1. Bartel DP. MicroRNAs: target recognition and regulatory functions. Cell. 2009;136:215–233. - PMC - PubMed
    1. Bartels CL, Tsongalis GJ. MicroRNAs: novel biomarkers for human cancer. Clin Chem. 2009;55:623–631. - PubMed
    1. Boyd SD. Everything you wanted to know about small RNA but were afraid to ask. Lab Invest. 2008;88:569–578. - PubMed
    1. Bracken CP, Gregory PA, Kolesnikoff N, Bert AG, Wang J, Shannon MF, et al. A double-negative feedback loop between ZEB1-SIP1 and the microRNA-200 family regulates epithelial-mesenchymal transition. Cancer Res. 2008;68:7846–7854. - PubMed

Publication types

MeSH terms