. 2012 Jan 8;44(2):206-11.
doi: 10.1038/ng.1066.

Crh and Oprm1 mediate anxiety-related behavior and social approach in a mouse model of MECP2 duplication syndrome

Affiliations

Crh and Oprm1 mediate anxiety-related behavior and social approach in a mouse model of MECP2 duplication syndrome

Rodney C Samaco et al. Nat Genet. .

Abstract

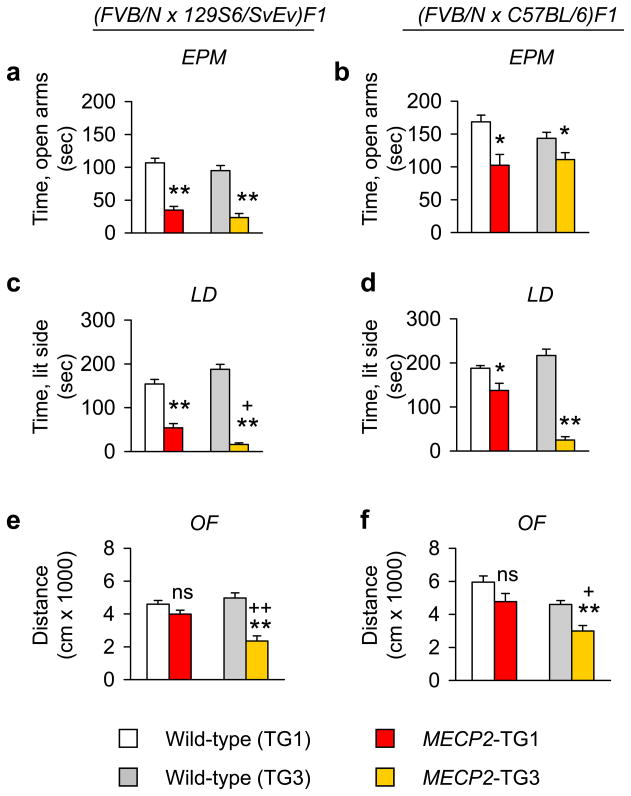
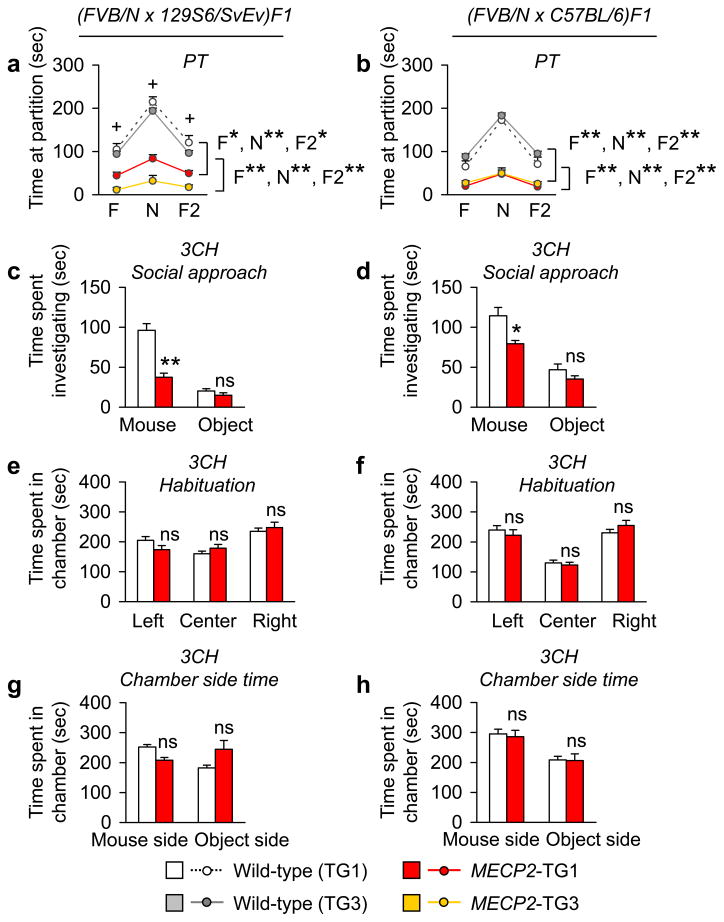
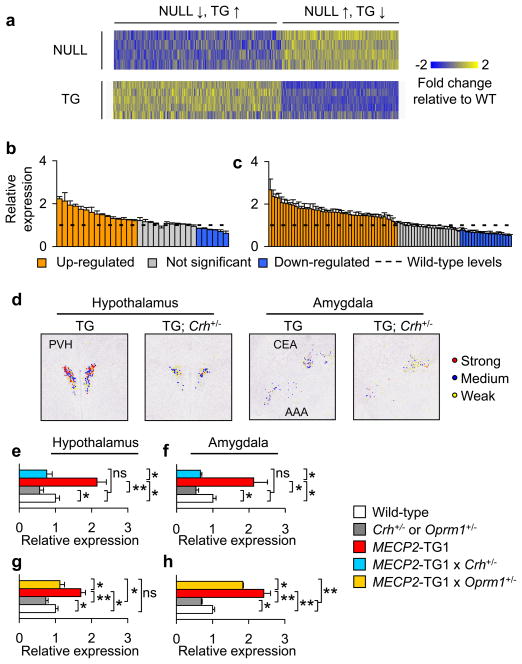
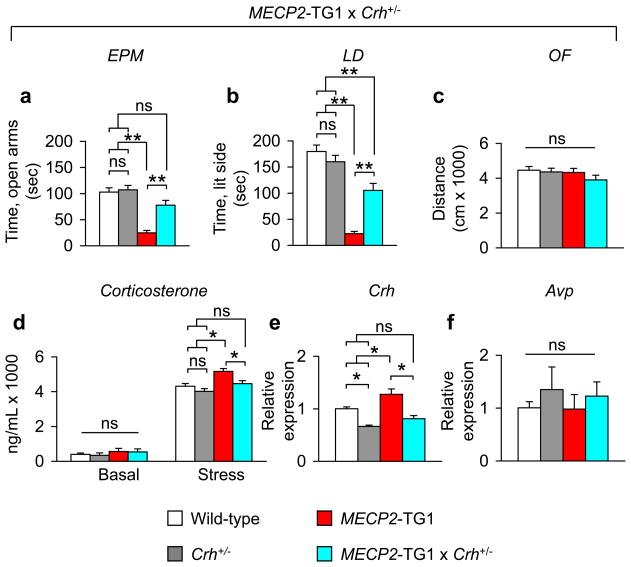
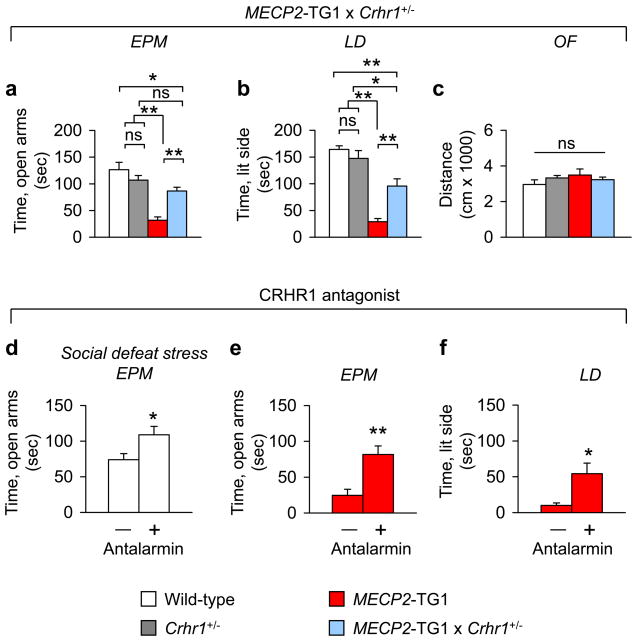
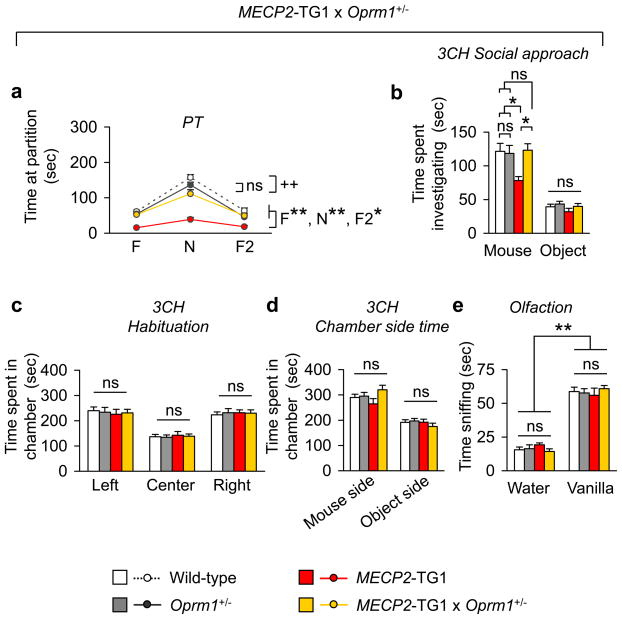
Genomic duplications spanning Xq28 are associated with a spectrum of phenotypes, including anxiety and autism. The minimal region shared among affected individuals includes MECP2 and IRAK1, although it is unclear which gene when overexpressed causes anxiety and social behavior deficits. We report that doubling MECP2 levels causes heightened anxiety and autism-like features in mice and alters the expression of genes that influence anxiety and social behavior, such as Crh and Oprm1. To test the hypothesis that alterations in these two genes contribute to heightened anxiety and social behavior deficits, we analyzed MECP2 duplication mice (MECP2-TG1) that have reduced Crh and Oprm1 expression. In MECP2-TG1 animals, reducing the levels of Crh or its receptor, Crhr1, suppressed anxiety-like behavior; in contrast, reducing Oprm1 expression improved abnormal social behavior. These data indicate that increased MeCP2 levels affect molecular pathways underlying anxiety and social behavior and provide new insight into potential therapies for MECP2-related disorders.


Conflict of interest statement

Conflict of interest

The authors declare no conflict of interest.

Supplementary Information accompanies the paper on the Nature Genetics website (http://www.nature.com/ng)

Figures

Figure 1
Figure 1. Increasing the endogenous levels of MeCP2 causes heightened anxiety-like behavior in mice
(a–d) MECP2-TG1 and -TG3 mice compared to respective wild-type littermate animals spend less time in the open arms of an elevated plus maze (a, b), and spend less time in the lit compartment of the light-dark box (c, d). (e, f) MECP2-TG1 mice compared to respective wild-type littermate animals travel a similar distance in an open field; in contrast MECP2-TG3 mice travel less compared with their wild-type littermates. Data from a, c, e correspond to (FVB/N × 129S6/SvEv)F1 animals; data from b, d, f correspond to (FVB/N × C57BL/6)F1 animals. White bars represent wild-type littermates for the MECP2-TG1 line (n=14–22), red bars represent MECP2-TG1 animals (n=10–22), grey bars represent wild-type littermates for the MECP2-TG3 line (n=20–27), orange bars represent MECP2-TG3 animals n=17–21). Values represent mean ± s.e.m., asterisks indicate significant differences between either MECP2-TG1 or -TG3 animals compared with their respective wild-type littermates, plus signs indicate significant differences between MECP2-TG1 and MECP2-TG3 animals. * and +, p value < 0.05; ** and ++, p value < 0.001; ns, not significant; EPM, elevated plus maze, LD, light dark box exploration; OF, open field. A complete statistical summary of behavioral data is provided in Supplementary Table 6.
Figure 2
Figure 2. Increasing the endogenous levels of MeCP2 causes social behavior deficits in mice
(a, b) MECP2-TG1 and -TG3 animals are less interested in their familiar or novel partner mice in the partition test for social interaction and recognition. Significant differences are denoted for familiar partners during the first encounter (F), novel partners (N), and familiar partners during a second encounter (F2). (c–h) In the three-chamber test for social approach, MECP2-TG1 mice compared to wild-type littermates spend the same amount of time investigating a novel object but are less interested in a novel mouse (c, d). MECP2-TG1 mice compared with wild-type littermates show no side preferences during either the habituation phase (e, f) or test phase (g, h). Data from a, c, e, g correspond to (FVB/N × 129S6/SvEv)F1 animals; data from b, d, f, h correspond to (FVB/N × C57BL/6)F1 animals. White bars and dashed lines represent wild-type littermates for the MECP2-TG1 line (n=12), red bars and lines represent MECP2-TG1 animals (n=10–12), grey lines represent wild-type littermates for the MECP2-TG3 lines (n=12–15), orange lines represent MECP2-TG3 animals (n=10–11). Values represent mean ± s.e.m., asterisks indicate significant differences between either MECP2-TG1 or -TG3 animals compared with their respective wild-type littermates, plus signs indicate significant differences between MECP2-TG1 and MECP2-TG3 animals. * and +, p value < 0.05; ** and ++, p value < 0.001; ns, not significant; PT, partition test for social interest and recognition; 3CH, three chamber test for sociability. A complete statistical summary of behavioral data is provided in Supplementary Table 6.
Figure 3
Figure 3. Gene expression analysis of the amygdala identifies a subset of altered genes implicated in anxiety and/or social behavior
(a) Transcriptional profiling heat map displaying fold changes of the 1,060 genes oppositely altered genes with a 0.2 to 2 log2-fold change in the two MeCP2 mouse models compared with wild-type littermates (q value < 0.05). (b, c) Quantitative real-time reverse transcription-PCR (qRT-PCR) results displaying fold changes of 32 anxiety- and/or social behavior-related genes (b) and 85 genes not implicated in anxiety and/or social behavior (c). Expression levels were normalized to wild-type levels (dashed line). For both b and c, orange bars represent statistically significant up-regulated genes, blue bars represent statistically significant down-regulated genes, and grey bars represent non-significant gene alterations. (d) In situ hybridization (ISH) shows that MECP2-TG1 animals have increased levels of Crh in the paraventricular nucleus of the hypothalamus and amygdala; in contrast MECP2-TG1;Crh+/− animals have reduced Crh levels. Representative images are pseudo-colored to indicate signal intensity levels (red=strong expression, blue=medium expression, yellow=weak expression). (e, f) Quantification of the signal intensity from multiple sections shows levels of Crh are decreased in MECP2-TG1; Crh+/− mice compared with MECP2-TG1 animals in both the hypothalamus (e) and amygdala (f). (g, h) QRT-PCR of Oprm1 levels demonstrate a reduction in expression levels in MECP2-TG1; Oprm1+/− double mutant animals compared with MECP2-TG1 littermates in both the hypothalamus (g) and the amygdala (h). For e–h, white bars represent wild-type littermates, dark grey bars represent Crh+/− littermates or Oprm1+/− littermates, red bars represent MECP2-TG1 littermates, blue bars represent MECP2-TG1; Crh+/− animals, and orange bars represent MECP2-TG1; Oprm1+/−animals. PVH, paraventricular nucleus; AAA, anterior amygdalar area; CEA, central amygdalar nucleus. Values represent mean ± s.e.m.; asterisks indicate significant differences between indicated genotypes. *, p value < 0.05; **, p value < 0.001; ns, not significant.
Figure 4
Figure 4. Genetic reduction of Crh improves anxiety-like behavior in MECP2 duplication mice
(a–c) MECP2-TG1; Crh+/− animals are less anxious in the elevated plus maze (a) and light-dark box (b). The total distance traveled in the open field is normal among all groups (c). (d) Basal corticosterone levels are normal in MECP2-TG1; Crh+/− double mutant animals compared with their respective littermates (n=3–6 animals of each genotype). Stress-induced corticosterone levels are significantly higher in MECP2-TG1 animals; this is suppressed in MECP2-TG1; Crh+/− animals (n=4 animals of each genotype). (e, f) Crh expression level differences in the amygdalae of an independent set of animals was confirmed by QPCR (e). Avp expression level differences were not observed across all genotypes (n=3–6 animals of each genotype) (f). For behavioral studies, white bars represent wild-type littermates (n=10–23,), dark grey bars represent Crh+/− littermates (n=17), red bars represent MECP2-TG1 littermates (n=13–21), and blue bars represent MECP2-TG1; Crh+/− animals (n=13–18). Values represent mean ± s.e.m.; asterisks indicate significant differences between indicated genotypes, *, p value < 0.05; **, p value < 0.001; ns, not significant; EPM, elevated plus maze, LD, light dark box exploration; OF, open field. A complete statistical summary of behavioral data is provided in Supplementary Table 6.
Figure 5
Figure 5. Genetic reduction of the CRH receptor, CRHR1, and pharmacologic intervention using a CRHR1 antagonist improves anxiety-like behavior in MECP2 duplication mice
(a–c) The levels of anxiety-like behavior in the elevated plus maze (a) and light-dark box (b) were suppressed in MECP2-TG1; Crhr1+/− animals. No difference was observed in the total distance traveled in an open field (c). (d) Pre-treatment with 60 mg/kg antalarmin had an anxiolytic effect in (FVB/N × 129S6/SvEv)F1 wild-type littermates of MECP2-TG1 mice in the elevated plus maze (vehicle group, n=20; antalarmin group, n=16). (e, f) Antalarmin-treated MECP2-TG1 animals spent more time in the open arms of the elevated plus maze (e) and spent more time in the lit side of the light dark box (f) (EPM vehicle group, n=14; antalarmin group, n=25; LD vehicle group, n=8; antalarmin group, n=17). For a–c, white bars represent wild-type littermates (n=12), dark grey bars represent Crhr1+/− littermates (n=15), red bars represent MECP2-TG1 littermates (n=9), light blue bars represent MECP2-TG1; Crhr1+/− animals (n=18). For d–f, dash or plus signs indicate either vehicle-treated animals (−) or 60 mg/kg antalarmin-treated animals (+). Values represent mean ± s.e.m.; asterisks indicate significant differences either among genotypes for genetic interaction data, or between drug-treated and vehicle-treated animals for antalarmin studies, *, p value < 0.05; **, p value < 0.001; ns, not significant; EPM, elevated plus maze, LD, light dark box exploration; OF, open field. A complete statistical summary of behavioral data is provided in Supplementary Table 6.
Figure 6
Figure 6. Genetic reduction of Oprm1 improves the social behavior deficits of MECP2 duplication mice
(a) Reducing the levels of Oprm1 in MECP2-TG1 animals improved their social behavior deficits, as double mutant mice spent more time investigating both familiar and novel partners compared with MECP2-TG1 mice (asterisks). The level of interest was similar to wild-type and Oprm1+/− mice for the familiar encounters, but for novel partners, the level of interest for double mutants was similar to Oprm1+/− but not wild-type mice (significant difference indicated by plus signs). (b) In the three chamber test, MECP2-TG1; Oprm1+/− double mutants demonstrated normal social approach behavior towards a novel partner mouse compared with both wild-type and Oprm1+/− animals; MECP2-TG1 animals showed a decrease in social approach behavior towards a novel partner mouse. All genotypes spent an equal time investigating a novel object. (c, d) MECP2-TG1; Oprm1+/− double mutant animals compared with their littermates showed no side preferences during the habituation (c) and test (d) phases. (e) Animals of all genotypes spent more time sniffing a novel odor (vanilla) compared with a familiar odor (water); no differences were observed among all genotypes in the time spent sniffing the odors. White bars and dashed lines represent wild-type littermates (n=13), dark grey bars and lines represent Oprm1+/− littermates (n=12), red bars and lines represent MECP2-TG1 littermates (n=9), and orange bars and lines represent MECP2-TG1; Oprm1+/− animals (n=10–12). Values represent mean ± s.e.m.; significant differences between genotypes are denoted by asterisks, for partition test data, asterisks indicate significant differences between MECP2-TG1 and littermates, and plus signs indicate significant differences between double mutants and wild-type littermates, *, p value < 0.05; ** or ++, p value < 0.001; ns, not significant; PT, partition test for social interest and recognition; 3CH, three chamber test for sociability. A complete statistical summary of behavioral data is provided in Supplementary Table 6.

Similar articles

Cited by

References

    1. Amir RE, et al. Rett syndrome is caused by mutations in X-linked MECP2, encoding methyl-CpG-binding protein 2. Nat Genet. 1999;23:185–188. - PubMed
    1. Lam CW. Spectrum of mutations in the MECP2 gene in patients with infantile autism and Rett syndrome. Journal of Medical Genetics. 2000;37:41e–41. - PMC - PubMed
    1. Watson P, et al. Angelman syndrome phenotype associated with mutations in MECP2, a gene encoding a methyl CpG binding protein. J Med Genet. 2001;38:224–228. - PMC - PubMed
    1. Klauck SM, et al. A mutation hot spot for nonspecific X-linked mental retardation in the MECP2 gene causes the PPM-X syndrome. Am J Hum Genet. 2002;70:1034–1037. - PMC - PubMed
    1. Carney RM, et al. Identification of MeCP2 mutations in a series of females with autistic disorder. Pediatr Neurol. 2003;28:205–211. - PubMed

Publication types

Associated data