. 2012 Jan 8;44(2):226-32.
doi: 10.1038/ng.1028.

De novo assembly and genotyping of variants using colored de Bruijn graphs

Affiliations

De novo assembly and genotyping of variants using colored de Bruijn graphs

Zamin Iqbal et al. Nat Genet. .

Abstract

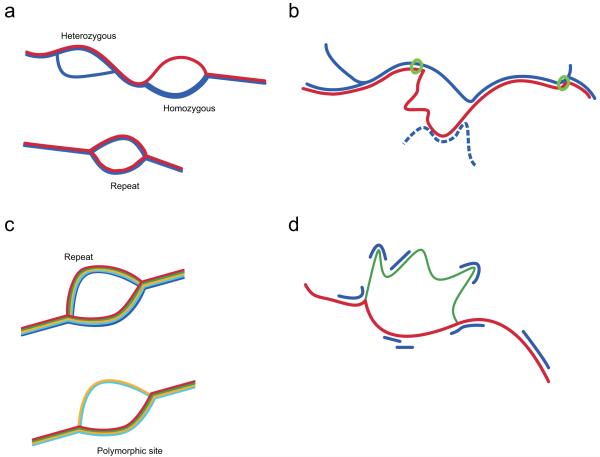
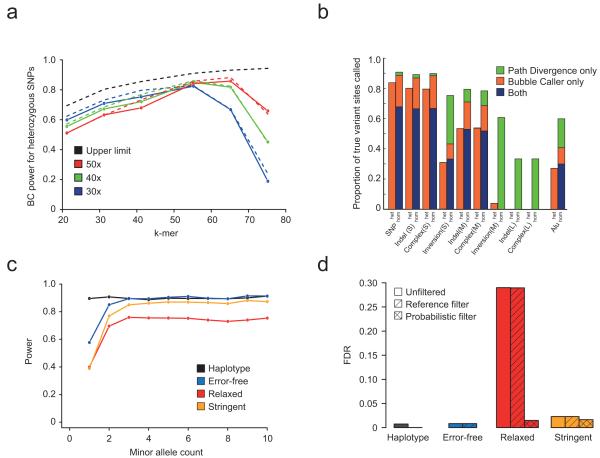
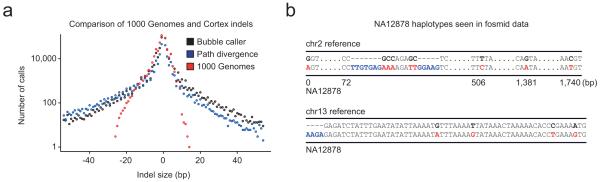
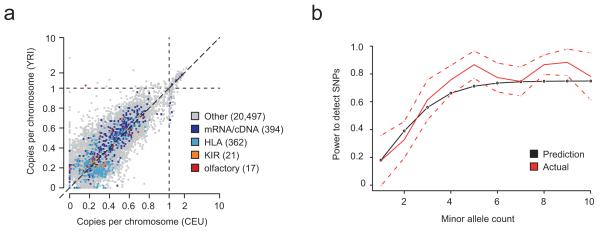
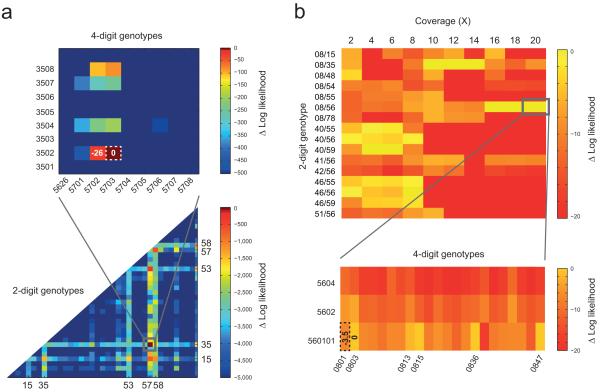
Detecting genetic variants that are highly divergent from a reference sequence remains a major challenge in genome sequencing. We introduce de novo assembly algorithms using colored de Bruijn graphs for detecting and genotyping simple and complex genetic variants in an individual or population. We provide an efficient software implementation, Cortex, the first de novo assembler capable of assembling multiple eukaryotic genomes simultaneously. Four applications of Cortex are presented. First, we detect and validate both simple and complex structural variations in a high-coverage human genome. Second, we identify more than 3 Mb of sequence absent from the human reference genome, in pooled low-coverage population sequence data from the 1000 Genomes Project. Third, we show how population information from ten chimpanzees enables accurate variant calls without a reference sequence. Last, we estimate classical human leukocyte antigen (HLA) genotypes at HLA-B, the most variable gene in the human genome.


Figures

Figure 1
Figure 1
Schematic representation of four methods of variation analysis using colored de Bruijn graphs; line width represents coverage. (a) Discovery of variants in a single outbred diploid individual (blue) with a reference sequence (red). True polymorphisms generate bubbles that diverge from the reference, while repeat structures lead to bubbles also observed in the reference. (b) Even when the reference allele (red) does not form a clean bubble, we can identify homozygous variant sites by tracking the divergence of the reference path from that of the sample. On finding a breakpoint, we take the longest contig in the sample (i.e. the path as far as the next junction) and ask whether the reference path returns before this point (green circle = anchoring sequence). The algorithm (path divergence) is not affected by repeat sequence within the reference allele present elsewhere in the genome of the sample (blue dotted). (c) When many samples (each in a different colour) are combined it is possible to distinguish repeat-induced bubbles (in which both sides of the bubble are present in all samples) from true variant sites (in which bubble coverage varies with genotypes and genotypes are in Hardy-Weinberg equilibrium). (d) The likelihood of any given genotype can be calculated from the coverage (blue) of each allele (green, red), accounting for contributions from other parts of the genome. In this example, the sample is heterozygous thus has coverage of both alleles, though not sufficient to enable full assembly.
Figure 2
Figure 2
Simulation-based evaluation of Cortex. (a) Power of the Bubble-calling (BC) algorithm to detect heterozygous SNPs in a single individual, as a function of k-mer size. Genome repeat content dictates an upper limit to power (black dashed line), while finite sequence coverage reduces power for large k-mer size (solid lines, circles) in a predictable manner (dashed lines). Increased coverage reduces power at lower k-mer sizes due to recurrent errors that evade error-cleaning. At high k (e.g. k=55, 50x) power is close to the upper limit. (b) Power to detect different variant types in homozygous and heterozygous states using the BC and Path divergence (PD) algorithms with 30x coverage (100bp reads, k=55). For simple variant types power is 80-85%. For medium-sized variants power remains high at homozygous sites, but is ≤50% at heterozygous sites. For large events, there is only power for homozygous sites and this only through PD. (c) Power to detect SNP variants using BC in population data (10 individuals, 10x coverage, 100bp reads, k=55). Fluctuations in coverage reduce power for low frequency variants. More stringent cleaning increases power because bubbles are less confounded by errors. (d) FDR for call sets in panel (c) before and after classifying bubbles as error-, repeat- or variant-induced. The probabilistic filter reduces FDR under relaxed cleaning from 29% to 1.5% with 1.7% loss in power and from 2.3% to 1.6% with 1% loss in power for the stringent cleaning.
Figure 3
Figure 3
Structural and complex variants identified in a single high coverage genome. (a) Size distribution of short indels discovered in NA12878 from 26x coverage of 100bp reads analysed using the BC (black) and PD (blue) algorithms. Also shown is the number of indels of different sizes called by mapping-based approaches from 63x coverage on the same sample within the 1000 Genomes Project (red). While the 1000 Genomes Project calls more small variants, only the two Cortex algorithms can detect longer variants, which are typically too short to be detected by larger structural variation discovery methods. The PD caller exhibits bias towards calling deletions for larger variant sizes. (b) Two examples of complex variants identified in NA12878 using Cortex and validated in the independent fosmid data. In the top example, the PD algorithm assembles a haplotype over 1.7kb containing a number of phased SNPs (red) and a complex insertion/deletion event (inserted material is blue). In the bottom example, the BC algorithm assembles two haplotypes containing four phased SNPs and an insertion.
Figure 4
Figure 4
Population analysis with Cortex. (a) Estimates of mean copy number per genome in CEU and YRI for novel sequence contigs identified from analysis of pooled population graphs for 164 humans sequenced to low depth (2-4x) with the 1000 Genomes Project. Contigs are all at least 100bp long and have <90% homology to the reference genome (determined by BLAST). Allelic variation lies in the interval (0,1), while copy-number variable sequence can be present up to 6.3 times. Variants are annotated by whether they show significant homology to known transcripts, including HLA, KIR and olfactory receptor (OR) genes as specific categories, which are clearly enriched. We note the presence of several OR matches that are approximately 20% frequency in YRI but apparently absent from CEU. (b) Power to detect SNP variants previously analysed through SNP genotyping in HTS data from 10 chimpanzees (6x coverage, 50bp reads analysed at k=31). Empirical estimates (red, with normal approximation to binomial confidence intervals shown dotted) closely track predictions (black) from the theoretical model.
Figure 5
Figure 5
HLA-B genotyping from HTS data using Cortex. (a) Heat-plot showing the likelihood surface for HLA-B genotypes for NA19240 (the child of the Yoruban trio from the 1000 Genomes Project). The lower part shows the likelihood surface at 2-digit resolution (represented by the most likely genotype among all compatible alleles) and the top shows a blow-up for the most-likely 2-digit genotype (B*57/B*35). The maximum likelihood genotype is B*57:03:01/B*35:01:01 which agrees with the 4-digit resolution data generated previously using standard experimental methods (MLE shown by dotted line; difference in log-likelihood from MLE shown for selected genotypes). Other alleles identified as possible at the 2-digit level (HLA-B*15, B*53 and B*58) are closely related to those present in the sample. B*53 is known to be a product of gene conversion from B*35, and B*58 is a split antigen from B*15 with sister serotype B*57. (b) Heat plot showing the likelihood surface at 2-digit resolution for selected HLA-B genotypes for NA12878 (top) as a function of sequence depth. The blow-up shows 4-digit level resolution at 20x. At low coverage there is no consistent most likely genotype; from 10-14x the most likely is B*08/B*35, which switches to B*56:01/B*08:xx (where xx = 03, 13, 15, 36 and 47; all have log likelihood within 0.03 units) at 16x. Lab-based typing gives B*56:01/B*08:01, which is 3.2 units in log-likelihood less than the MLE.

Similar articles

Cited by

References

    1. Langmead B, Trapnell C, Pop M, Salzberg SL. Ultrafast and memory-efficient alignment of short DNA sequences to the human genome. Genome Biol. 2009;10:R25. - PMC - PubMed
    1. Li H, Durbin R. Fast and accurate long-read alignment with Burrows-Wheeler transform. Bioinformatics. 2010;26:589–95. - PMC - PubMed
    1. Li H, Ruan J, Durbin R. Mapping short DNA sequencing reads and calling variants using mapping quality scores. Genome Res. 2008;18:1851–8. - PMC - PubMed
    1. Li R, Li Y, Kristiansen K, Wang J. SOAP: short oligonucleotide alignment program. Bioinformatics. 2008;24:713–4. - PubMed
    1. Lunter G, Goodson M. Stampy: A statistical algorithm for sensitive and fast mapping of Illumina sequence reads. Genome Res. 2010 - PMC - PubMed

Publication types