. 2012 Jan 8;44(2):212-6.
doi: 10.1038/ng.1042.

Genome-wide patterns of genetic variation in worldwide Arabidopsis thaliana accessions from the RegMap panel

Affiliations

Genome-wide patterns of genetic variation in worldwide Arabidopsis thaliana accessions from the RegMap panel

Matthew W Horton et al. Nat Genet. .

Abstract

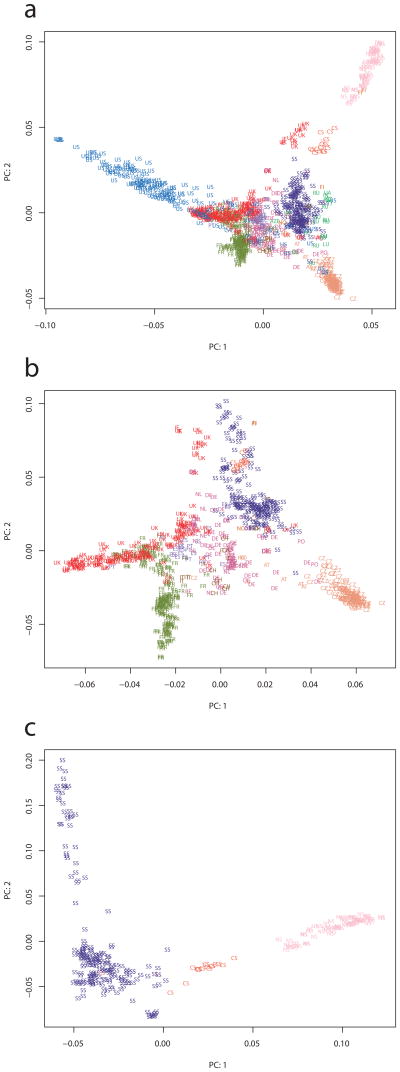
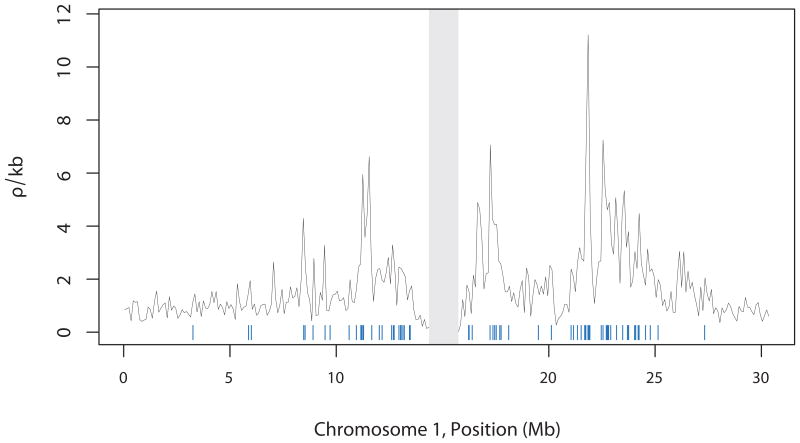
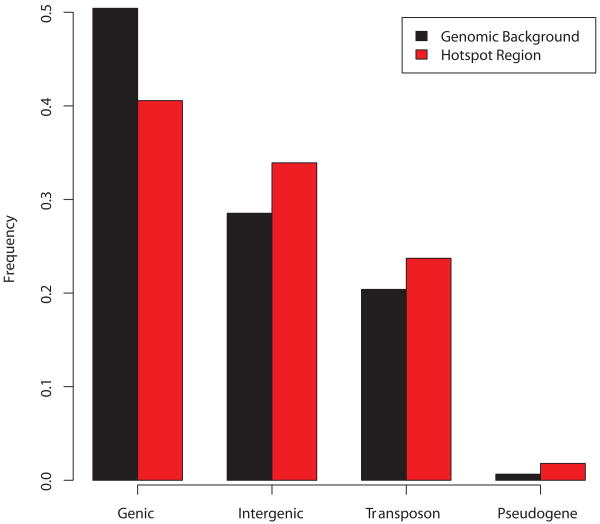
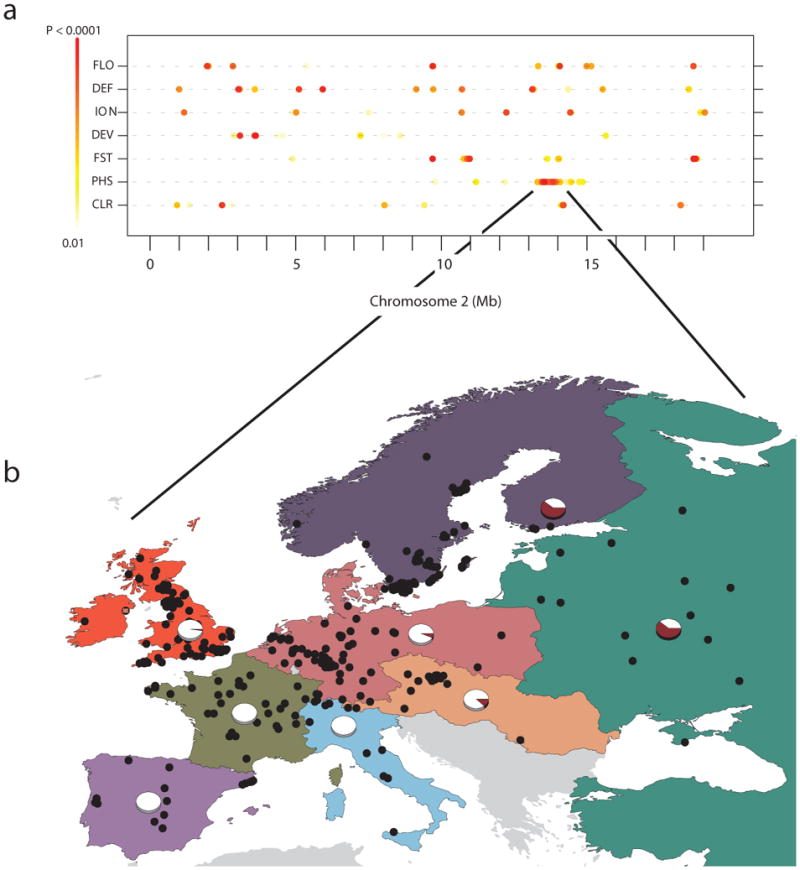
Arabidopsis thaliana is native to Eurasia and is naturalized across the world. Its ability to be easily propagated and its high phenotypic variability make it an ideal model system for functional, ecological and evolutionary genetics. To date, analyses of the natural genetic variation of A. thaliana have involved small numbers of individual plants or genetic markers. Here we genotype 1,307 worldwide accessions, including several regional samples, using a 250K SNP chip. This allowed us to produce a high-resolution description of the global pattern of genetic variation. We applied three complementary selection tests and identified new targets of selection. Further, we characterized the pattern of historical recombination in A. thaliana and observed an enrichment of hotspots in its intergenic regions and repetitive DNA, which is consistent with the pattern that is observed for humans but which is strikingly different from that observed in other plant species. We have made the seeds we used to produce this Regional Mapping (RegMap) panel publicly available. This panel comprises one of the largest genomic mapping resources currently available for global natural isolates of a non-human species.


Figures

Figure 1
Figure 1. Principal component analysis (PCA) of the study samples
(a) A plot of PC1 and PC2 distinguishes the largest samples although some overlap is evident in the center of the distribution (b) A plot like in ‘a’ but of the core collection area, excluding the Americas and Northern Sweden. (c) The top two components from a PCA of Fennoscandia, the largest regional sample. Key: Portugal = PT; Spain = ES; Italy = IT; Switzerland = CH; Belgium = BE, Netherlands = NL, Denmark = DK, Germany = DE; Poland = PO; Norway = NO; Finland = FI; Austria = AT; Czech Republic = CZ; Romania = RO, Estonia = EE; Lithuania = LT; Belarus = BY; Ukraine = UA; Georgia = GE; Azerbaijan = AZE; Russia = RU; Tajikistan = TJ; Kashmir = KS; Sweden is separated into Southern (SS), Central (CS) and Northern Sweden (NS).
Figure 2
Figure 2. Recombination rate variation for chromosome 1
Shown are estimates of recombination rate, in 100-kb windows (black), and the location of hotspots (blue; centromere excluded in gray). The hotspots shown were identified in at least 8 of the 9 regional samples (ρ/kb > 3).
Figure 3
Figure 3. The proportion of DNA in and out of inferred hotspots
Separating hotspot regions from the genomic background we see a deficit of genic DNA in hotspot regions and a strong enrichment for DNA classified as either intergenic, transposable element (TE) or pseudogene.
Figure 4
Figure 4. Overlap of selection scans with results from GWAS on chromosome 2
(a) The top 1% (genome wide) of scores are shown for three scans of selection (FST, PHS and CLR); also shown are the top results from GWAS of 107 phenotypes separated into 4 phenotypic categories: Flowering (FLO), Defense (DEF), Ionomics (ION) and Development (DEV). (b) The geographic distribution of an unusually long haplotype (frequency shown in pie charts) identified by both the PHS and FST scans (Chr 2: 13.44 – 13.86 Mb).
Figure 5
Figure 5. Enrichment of GWAS results with signals of selection
SNPs associated with both (a) silique length and (b) in planta concentration of Boron are strongly enriched in the extreme tail of scans testing for signatures of selection (e.g., −log10 rank statistic = 1 corresponds to the 10% tail). The sizes of the circles denote significance based on 1000 permutations (smallest circle shown corresponds to p=0.032 and the largest circle corresponds to p=0.001). GWAS SNPs were considered if their minor allele frequency was larger than 5% and when P < 1×10⁻⁴.

Comment in

References

    1. Atwell S, et al. Genome-wide association study of 107 phenotypes in Arabidopsis thaliana inbred lines. Nature. 2010;465:627–631. - PMC - PubMed
    1. Brachi B, et al. Linkage and Association Mapping of Arabidopsis thaliana Flowering Time in Nature. Plos Genetics. 2010;6 - PMC - PubMed
    1. Li Y, Huang Y, Bergelson J, Nordborg M, Borevitz JO. Association mapping of local climate-sensitive quantitative trait loci in Arabidopsis thaliana. Proc Natl Acad Sci U S A. 2010;107:21199–204. - PMC - PubMed
    1. Baxter I, et al. A coastal cline in sodium accumulation in Arabidopsis thaliana is driven by natural variation of the sodium transporter AtHKT1;1. PLoS Genet. 2010;6:e1001193. - PMC - PubMed
    1. Kim S, et al. Recombination and linkage disequilibrium in Arabidopsis thaliana. Nat Genet. 2007;39:1151–5. - PubMed