. 2013 Apr;13(2):110-20.
doi: 10.1038/tpj.2011.60. Epub 2012 Jan 10.

Genetic and epigenetic regulation of the organic cation transporter 3, SLC22A3

Affiliations

Genetic and epigenetic regulation of the organic cation transporter 3, SLC22A3

L Chen et al. Pharmacogenomics J. 2013 Apr.

Abstract

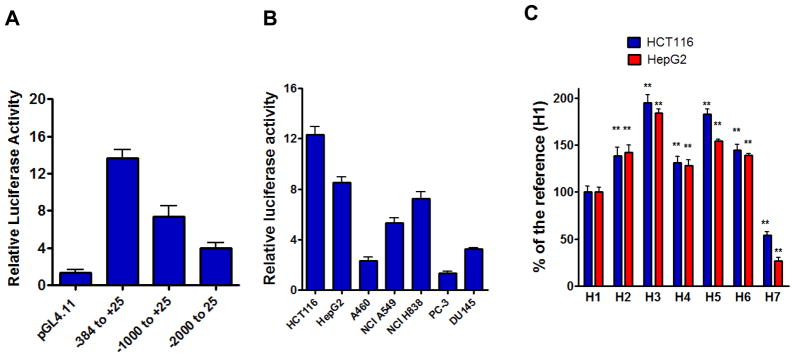
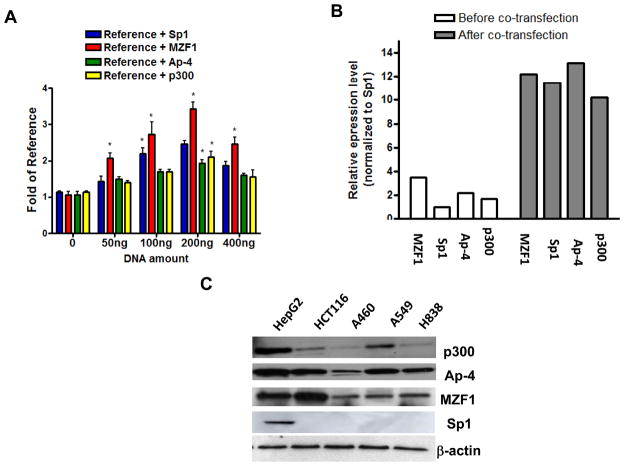
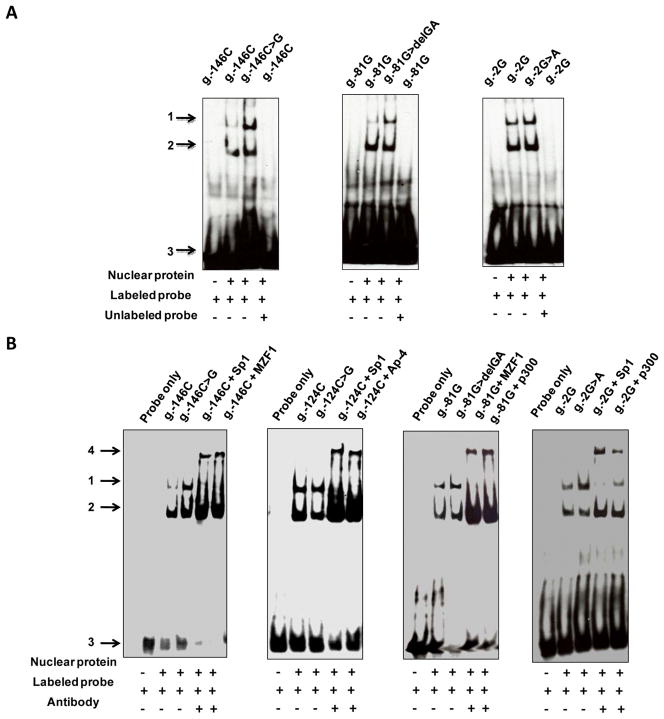
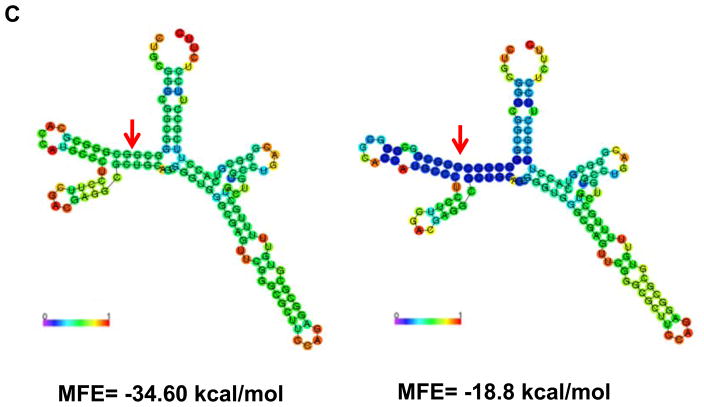
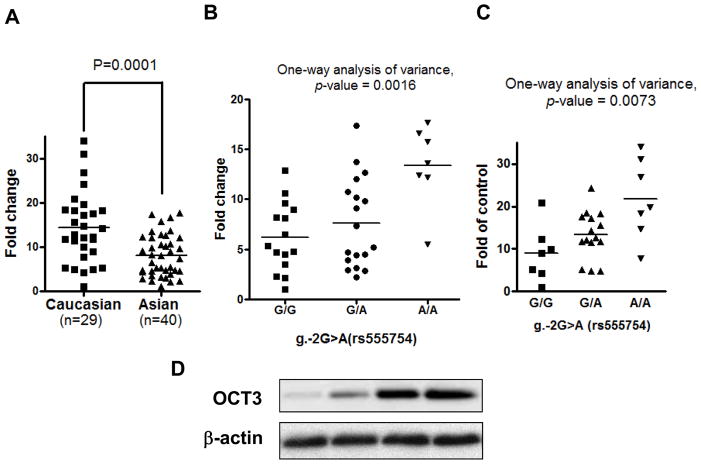
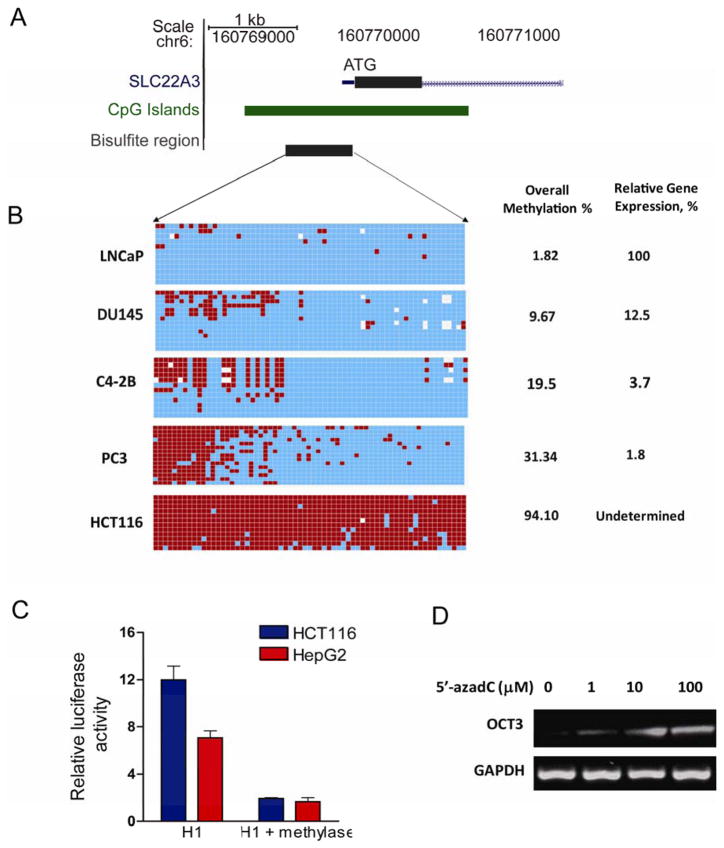
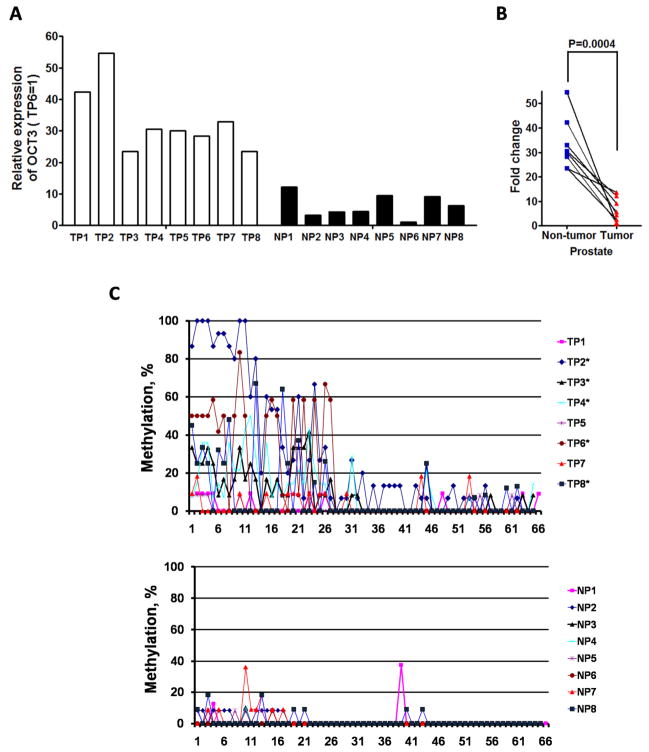
Human organic cation transporter 3 (OCT3 and SLC22A3) mediates the uptake of many important endogenous amines and basic drugs in a variety of tissues. OCT3 is identified as one of the important risk loci for prostate cancer, and is markedly underexpressed in aggressive prostate cancers. The goal of this study was to identify genetic and epigenetic factors in the promoter region that influence the expression level of OCT3. Haplotypes that contained the common variants, g.-81G>delGA (rs60515630) (minor allele frequency 11.5% in African American) and g.-2G>A (rs555754) (minor allele frequency>30% in all ethnic groups) showed significant increases in luciferase reporter activities and exhibited stronger transcription factor-binding affinity than the haplotypes that contained the major alleles. Consistent with the reporter assays, OCT3 messenger RNA expression levels were significantly higher in Asian (P<0.001) and Caucasian (P<0.05) liver samples from individuals who were homozygous for g.-2A/A in comparison with those homozygous for the g.-2G/G allele. Studies revealed that the methylation level in the basal promoter region of OCT3 was associated with OCT3 expression level and tumorigenesis capability in various prostate cancer cell lines. The methylation level of the OCT3 promoter was higher in 62% of prostate tumor samples compared with matched normal samples. Our studies demonstrate that genetic polymorphisms in the proximal promoter region of OCT3 alter the transcription rate of the gene and may be associated with altered expression levels of OCT3 in human liver. Aberrant methylation contributes to the reduced expression of OCT3 in prostate cancer.


Conflict of interest statement

Conflict of interest

Authors declare there are no competing financial interests in relation to the work.

Figures

Figure 1
Figure 1. Luciferase activities in cell lines expressing reporter constructs containing the basal promoter of OCT3
The reporter activity of each construct was compared with that of empty vector (pGL4.11). Data shown represent mean ± SD from triplicate wells in a representative experiment. A, Effect of promoter segment on luciferase activity. Three segments from the promoter region were cloned into the pGL4.11 vector. The basal promoter region (−384 to +25) showed higher luciferase activity than the longer counterparters (−1000 to +24 and −2000 to +25). The reason to include a small fragment of coding region (0 – 25) is to facilitate the cloning because of the high GC percentage in the promoter region. The starting codon in the (−384 to +25) was mutated to AAG to avoid interruption of luciferase expression. B. The luciferase activity of basal promoter reporter construct in different cell lines. The HCT116 and HepG2 had higher luciferase activities than the rest of the cell lines. C. The luciferase activity of 7 Haplotypes (H1–H7) from Table 1B. The g.-2A is contained in H3, H5 and H6. H1, H2, H4 and H7 have the g.-2G at the −2 position. **P<0.01 compared with H1.
Figure 2
Figure 2. Effects of four predicted transcriptional factors on the promoter activity of OCT3
A. Dose Effects of transcription factors on luciferase activity. Various doses of four predicted transcription factors (Sp1, MZF1, Ap4 and p300) were co-transfected with the reference construct (H1, reference). Data shown represent mean ± SD from triplicate wells in a representative experiment. *P < 0.05 vs. H1 activity without co-transfection of transcription factor accordingly. B, Expression levels of 4 TFs before co-transfection and after cotransfection. All the expression values were normalized to the lowest expression Sp1 which was set as 1.0. C. Western blots of five cell lines used in the luciferase assay to detect the expression of the four major transcription factors. Four antibodies against the above transcription factors were used to detect the expression of Sp1, MZF1, Ap-4 and p300. MZF1 showed strongest expression in HCT116. Sp1 was only detected in the HepG2 cells.
Figure 3
Figure 3. Electrophoretic mobility shift analysis of OCT3 reference and variant oligonucleotides and prediction of secondary structure of mRNA
A, Three paired oligonucleotide probes corresponding to the references and genetic variants (g.-146C and g.-146C>G, g.-81G and g.-81G>delGA, g.-2G and g.-G>A) were used to compared the nuclear protein binding affinity between the references and variants. Digoxigenin-labeled probes (Table S1) were incubated with nuclear extracts from HepG2 in the presence or absence of a 25-fold excess of unlabeled competitor as indicated. Band 1 is the nuclear protein – DNA complex. Band 2 and 3 are non-specific band and free probe, respectively. B, Supershift analysis with transcription factor specific antibodies. Supershifts were detected for all four transcription factors. The probe was incubated with nuclear extracts from HepG2 cells in the presence or absence of a specific antibody against Sp1, MZF1, Ap-4 and p300 as indicated. Band 1, 2 and 3 are the same annotation as 3C. Band 4 represents the antibody-nuclear protein-DNA complex as super-shift band. C, Prediction of secondary structure of mRNA (1 to 300) of OCT3 without g.+2T (left panel) or with insertion g.+2T>insGCGGGCG (right panel). MFE is listed below the structure.
Figure 4
Figure 4. The effect of genotype, g. –2G>A (rs555754) on OCT3 expression levels in human liver samples from Asian and Caucasian subjects
Expression of OCT3 in the human liver tissues was determined by a quantitative real-time RT-PCR and Western blotting. The horizontal bar for each genotype represents the mean value. The P value is calculated using Student’s t test. A, Caucasian liver samples (29) had significantly higher OCT3 mRNA level (P=0.005) than that of Asian (40). The lowest expression sample from one of the Asian sample is set as 1 and the rest of the samples were normalized to it. The mean values are 13.0 ± 1.7 for Caucasian and 8.1 ± 0.74 for Asian. B, The effect of genotype, g. –2G>A on OCT3 expression levels in human liver tissues from Asian (Chinese). The individuals with homozygous g.-2A/A had a significant higher OCT3 mRNA level than those with g.-2G/G and g.-2G/A. C. The effect of genotype, g. –2G>A on OCT3 expression levels in human liver tissues from Caucasian which showed the similar trend as those of Asian. D, Validation of the protein expression level of OCT3 with western blotting from 4 Asian liver samples with the lowest one (set as 1.0), two modest ones (6.5 and 12.8) and highest (17.2).
Figure 5
Figure 5. Effect of methylation of the OCT3 promoter on its expression in cancer cell lines
A, Diagram of the 5′ end of the partial OCT3 gene. The rectangles represent the exon 1 of the gene, the CpG islands and the region for bisulfite sequencing assay, respectively. B, The methylation status of the OCT3 promoter in cancer cell lines. Methylation of the OCT3 CpG islands in LNCaP, DU145, C4-2B, PC3 and HCT116 cell lines. Left, each square represents a CpG site from the 1st to 66th; blue, unmethylated; red, methylated; white, data not available. Right, the overall methylation level and the relative OCT3 gene expression of these cell lines. C, Effect of methylase on the luciferase activity of the OCT3 reference promoter (H1) construct in HCT116 and HepG2. As shown, the OCT3 basal promoter exhibits dramatically reduced reporter activity in the presence of CpG mehtylase SssI. D. Demethylation reagent 5′-azadC activated the expression of OCT3 in HCT116 which was highly methylated shown in B. 5′-azadC increased the expression of OCT3 with a dose-dependent manner.
Figure 6
Figure 6. Analysis of expression and methylation in paired normal and cancerous prostate samples
A and B, Expression levels of mRNA transcripts of OCT3 in 8 matched tumor-normal tissue samples from prostate cancer patients. The lowest expression level sample is set as 1.0 and the rest of the samples were normalized to it. The expression of OCT3 in normal prostate tissue was significantly higher than those in cancerous ones. C. Aberrant methylation of OCT3 promoter in primary prostate cancer samples. The methylation % of each CpG site is plotted for eight prostate cancer samples (upper panel) and eight normal prostate samples (lower panel). Y-axis is the methylation %; X-axis is the individual CpG sites (1–66). The methylation status of the CpG island was analyzed by sequencing subclones of PCR products from bisulfite-treated DNA. Each samples had at least 10 clones. For each CpG site, the methylation percentage was calculated by dividing the number of methylated clones by the total number of clones sequenced. 5 aberrant methylation tumor samples were labeled with *. NP, normal prostate tissue; TP, prostate cancer tissue. Each square represented a CpG site, blue, unmethylated; red, methylated; white, data not available.

Similar articles

Cited by

References

    1. Tregouet DA, Konig IR, Erdmann J, Munteanu A, Braund PS, Hall AS, et al. Genome-wide haplotype association study identifies the SLC22A3-LPAL2-LPA gene cluster as a risk locus for coronary artery disease. Nat Genet. 2009;41:283–5. - PubMed
    1. Lazar A, Walitza S, Jetter A, Gerlach M, Warnke A, Herpertz-Dahlmann B, et al. Novel mutations of the extraneuronal monoamine transporter gene in children and adolescents with obsessive-compulsive disorder. Int J Neuropsychopharmacol. 2008;11:35–48. - PubMed
    1. Eeles RA, Kote-Jarai Z, Giles GG, Al Olama AA, Guy M, Jugurnauth SK, et al. Multiple newly identified loci associated with prostate cancer susceptibility. Nature Genet. 2008;40:316–21. - PubMed
    1. Tomlins SA, Mehra R, Rhodes DR, Cao X, Wang L, Dhanasekaran SM, et al. Integrative molecular concept modeling of prostate cancer progression. Nat Genet. 2007;39:41–51. - PubMed
    1. Cui R, Okada Y, Jang SG, Ku JL, Park JG, Kamatani Y, et al. Common variant in 6q26-q27 is associated with distal colon cancer in an Asian population. Gut. 2001 [Epub ahead of print] - PMC - PubMed

Publication types

MeSH terms

Substances