Review
. 2012 Jan 10;9(3):172-84.
doi: 10.1038/nrcardio.2011.208.

Systems-based approaches to cardiovascular disease

Affiliations
Review

Systems-based approaches to cardiovascular disease

W Robb MacLellan et al. Nat Rev Cardiol. .

Abstract

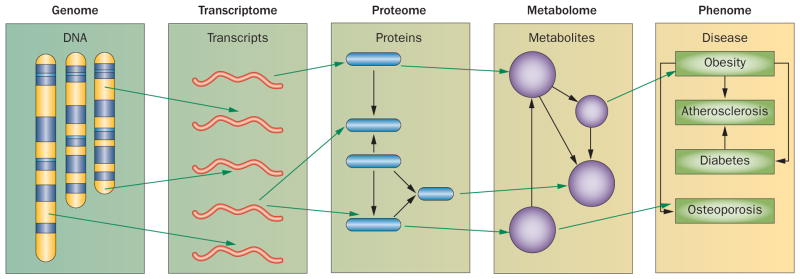
Common cardiovascular diseases, such as atherosclerosis and congestive heart failure, are exceptionally complex, involving a multitude of environmental and genetic factors that often show nonlinear interactions as well as being highly dependent on sex, age, and even the maternal environment. Although focused, reductionistic approaches have led to progress in elucidating the pathophysiology of cardiovascular diseases, such approaches are poorly powered to address complex interactions. Over the past decade, technological advances have made it possible to interrogate biological systems on a global level, raising hopes that, in combination with computational approaches, it may be possible to more fully address the complexities of cardiovascular diseases. In this Review, we provide an overview of such systems-based approaches to cardiovascular disease and discuss their translational implications.


Conflict of interest statement

Competing interests

The authors declare no competing interests.

Figures

Figure 1
Figure 1
Construction of a protein-interaction network. The following approach was used by Behrends et al. to study autophagy, a cellular process that has been linked to various cardiovascular diseases. Proteins previously known to be involved in authophagy (red circles with letters) were retrovirally expressed as Flag–HA fusion proteins in cultured cells. Proteins and their binding partners (numbered blue circles) were then precipitated using anti-HA antibodies and identified by mass spectrometry. An additional set of interacting proteins that were identified in the first experiments acted as secondary ‘baits and was processed identically. This ‘reciprocal’ analysis allowed validation of the original findings and identified connections between the baits of the first set of experiments as well as with other proteins (numbered yellow circles). The network was then further refined using mutagenesis and RNA interference. Abbreviation: HA, hemaglutinin.
Figure 2
Figure 2
Principles of eQTL analysis. Loci that control transcript levels are referred to as eQTL. Typically, eQTL analysis of humans or mice reveals thousands of eQTL, which are classified as either ‘local’ or ‘distant’, depending on the distance of the locus from the gene that an eQTL regulates. a. A local eQTL most likely acts in cis, meaning it affects the expression of a gene on the same chromosome (for example, an eQTL in a promoter only influences expression of the contiguous gene). b. Distal loci act in trans, affecting both copies of the genes they regulate (for example, an eQTL may encode a transcription factor that controls the expression of the regulated gene on both chromosomes). c. This panel illustrates possible causal relationships between a SNP, a transcript (RNA) and a physiological or pathologic trait (phenotype). Using the SNP as a ‘causal anchor’, causal relationships between the three can be modeled. Abbreviations: eQTL, expression quantitative trait locus; SNP, single nucleotide polymorphism.
Figure 3
Figure 3
Construction of a co-expression network. a. Identify a system of interest (for example, a cell or an animal model) and perturb it in multiple ways (for example, using siRNA or via a series of genetic knockouts). b. Quantitate mRNA transcripts using gene-expression arrays or high-throughput RNA sequencing. c. Identify transcripts that have similar patterns of expression and d. construct a correlation matrix for all transcripts. e. Transform data to a topographical overlap matrix using appropriate algorithms for hierarchical clustering of transcripts (‘modules’). f. Represent data as a graph with genes as circles (‘nodes’) and correlations in expression levels as lines between nodes (‘edges’). Highly connected genes, or ‘hubs’, are indicated by blue circles. In this example, three ‘modules’ of highly connected genes are shown.
Figure 4
Figure 4
Complex interactions in CAD. This schematic diagram depicts our current knowledge of the factors that determine CAD and CHF and their complex interactions. The blue boxes contain risk factors or initiating factors for the disease, orange boxes stand for disease-related traits, and the red-brown boxes represent diseases. The yellow arrow on the left indicates that all these interactions depend on genetic background and patient sex, and that changes are chronic. Abbreviations: CAD, coronary artery disease; CHF, chronic heart failure; EC, endothelial cell; ECM extracellular matrix; ROS, reactive oxygen species; TG, triglycerides; TMA, trimethylamine; TMAO, TMA N-oxide.
Figure 5
Figure 5
Systems genetics for analysis of complex disease. Although traditional genetic approaches (including genome-wide association studies) attempt to directly relate genetic variation to clinical traits, system genetics monitors various molecular phenotypes, such as levels of mRNA (transcriptome), proteins (proteome), and metabolites (metabolome) as a function of genetics. The molecular data can then be used to identify genetic loci that control their levels (such as expression quantitative trait loci), and such loci can be intersected with loci for clinical traits (phenome). Alternatively, the molecular data can help to model biological networks.
Figure 6
Figure 6
Network analysis provides context to hits in GWAS. a. A GWAS study for atherosclerosis (involving more than 100,000 individuals) identified genetic loci containing many novel genes contributing to atherosclerosis. b. One of these genes, NT5C2, formed a ’hub’ in the ‘green’ module of a human endothelial-cell inflammatory co-expression network. c. The detailed view of the ‘green’ hub reveals interaction partners of NT5C2. Abbreviation: GWAS, genome-wide association studies. Permission for panel a obtained from Nature Publishing Group © Schunkert, H. et al. Nat. Genet. 43, 333–338 (2011).

Similar articles

Cited by

References

    1. Schunkert H, et al. Large-scale association analysis identifies 13 new susceptibility loci for coronary artery disease. Nat Genet. 2011;43:333–338. - PMC - PubMed
    1. Barabasi AL. Linked: The new science of networks. Penguin Books; London: 2002.
    1. Bousquet J, et al. Systems medicine and integrated care to combat chronic noncommunicable diseases. Genome Med. 2011;3:43. - PMC - PubMed
    1. Ideker T, Galitski T, Hood L. A new approach to decoding life: systems biology. Annu Rev Genomics Hum Genet. 2001;2:343–372. - PubMed
    1. Nadeau JH, Subramaniam S. Systems biology and medicine: a new take on an old paradigm. Wiley Interdiscip Rev Syst Biol Med. 2009;1:1–3. - PubMed