Measurement of the equilibrium relative humidity for common precipitant concentrations: facilitating controlled dehydration experiments
- PMID: 22232186
- PMCID: PMC3253849
- DOI: 10.1107/S1744309111054029
Measurement of the equilibrium relative humidity for common precipitant concentrations: facilitating controlled dehydration experiments
Abstract
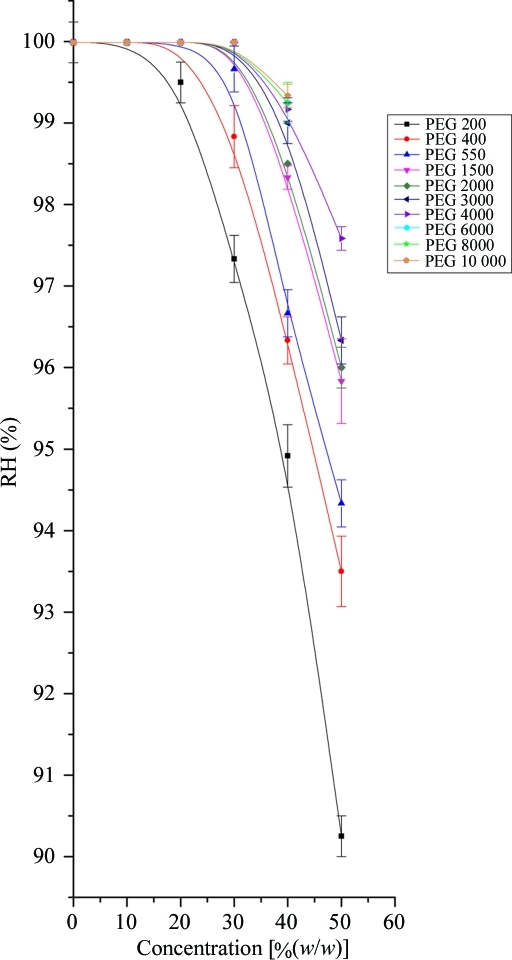
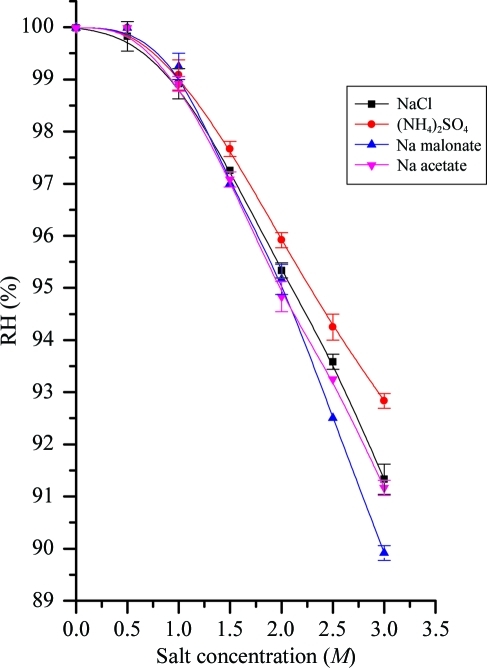
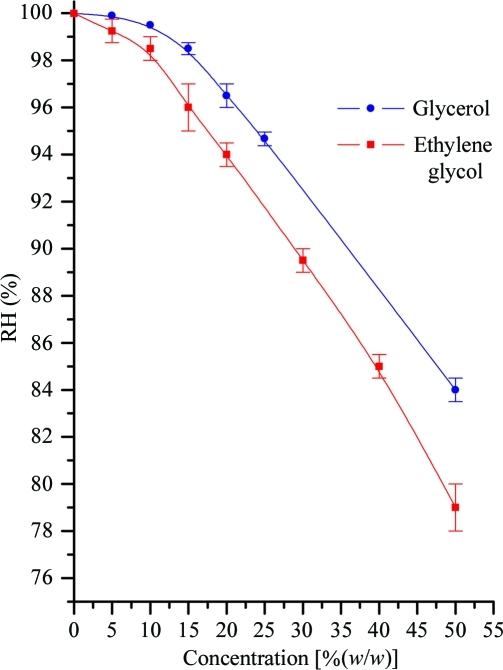
The dehydration of crystals of macromolecules has long been known to have the potential to increase their diffraction quality. A number of methods exist to change the relative humidity that surrounds crystals, but for reproducible results, with complete characterization of the changes induced, a precise humidity-control device coupled with an X-ray source is required. The first step in these experiments is to define the relative humidity in equilibrium with the mother liquor of the system under study; this can often be quite time-consuming. In order to reduce the time spent on this stage of the experiment, the equilibrium relative humidity for a range of concentrations of the most commonly used precipitants has been measured. The relationship between the precipitant solution and equilibrium relative humidity is explained by Raoult's law for the equilibrium vapour pressure of water above a solution. The results also have implications for the choice of cryoprotectant and solutions used to dehydrate crystals. For the most commonly used precipitants (10-30% PEG 2000-8000), the starting point will be a relative humidity of 99.5%.
© 2012 International Union of Crystallography. All rights reserved.
Figures
References
-
- Adachi, H., Umena, Y., Enami, I., Henmi, T., Kamiya, N. & Shen, J.-R. (2009). Biochim. Biophys. Acta, 1787, 121–128. - PubMed
-
- Arakali, S. V., Luft, J. R. & DeTitta, G. T. (1995). Acta Cryst. D51, 772–779. - PubMed
-
- Atha, D. H. & Ingham, K. C. (1981). J. Biol. Chem. 256, 12108–12117. - PubMed
-
- Berthou, J., Cesbron, F. & Laurent, A. (1972). J. Mol. Biol. 71, 809–813. - PubMed
MeSH terms
Substances
LinkOut - more resources
Full Text Sources
Other Literature Sources