. 2012 Feb;122(2):639-53.
doi: 10.1172/JCI59227. Epub 2012 Jan 9.

Oncogenic Kras is required for both the initiation and maintenance of pancreatic cancer in mice

Affiliations

Oncogenic Kras is required for both the initiation and maintenance of pancreatic cancer in mice

Meredith A Collins et al. J Clin Invest. 2012 Feb.

Abstract

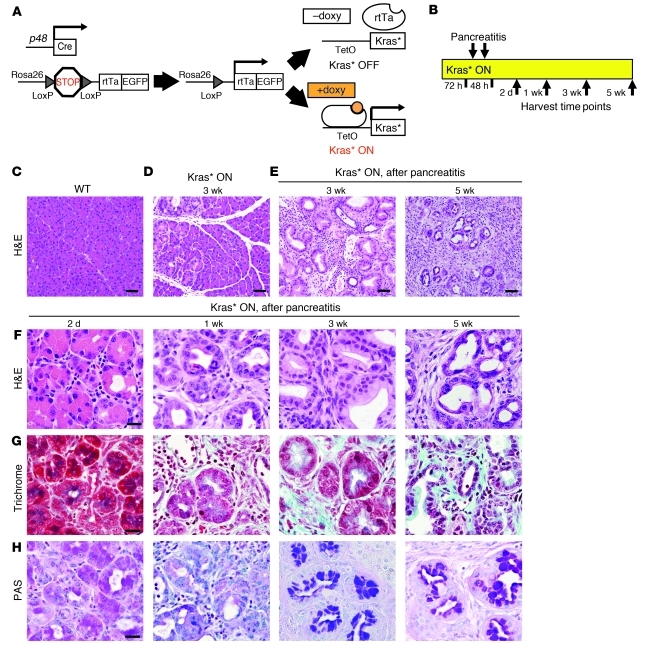
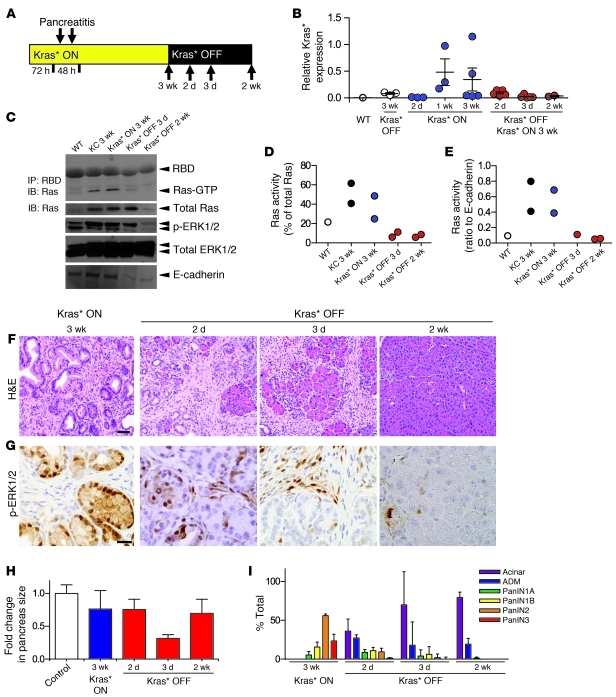
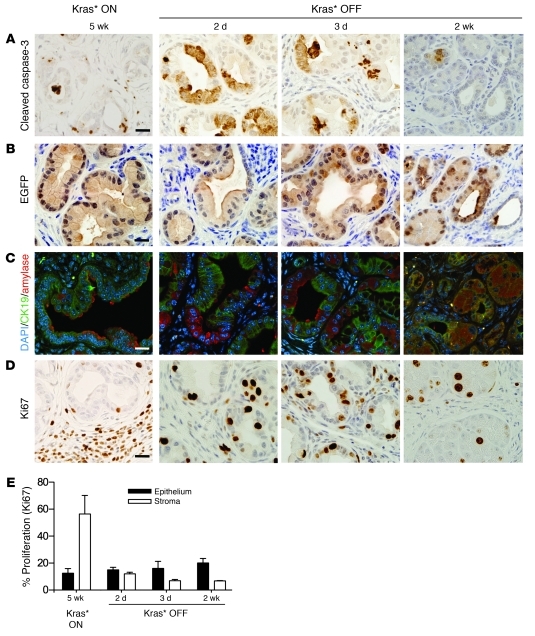
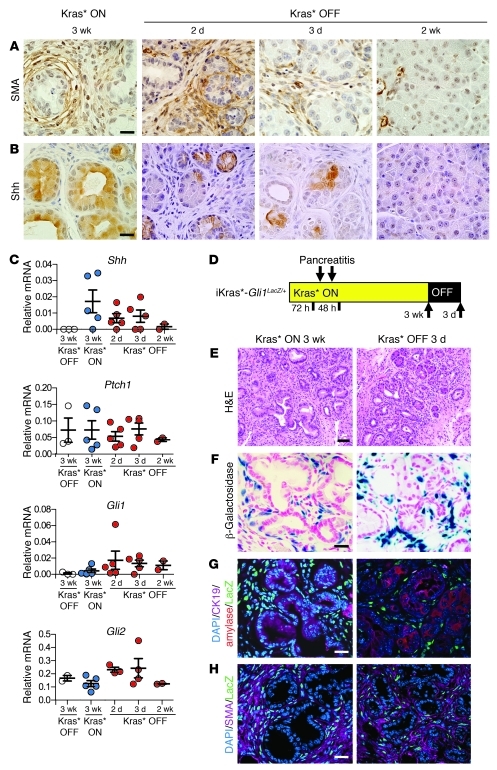
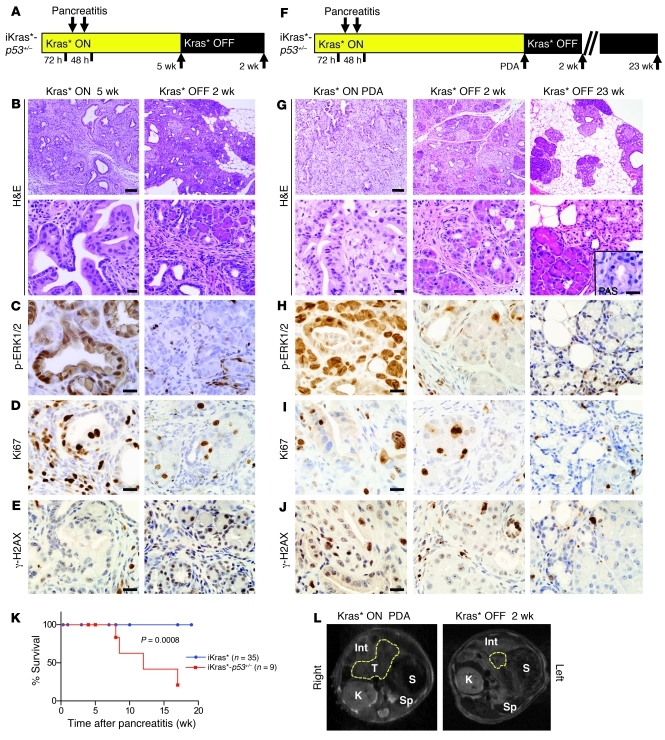
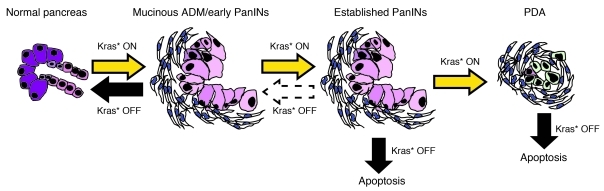
Pancreatic cancer is almost invariably associated with mutations in the KRAS gene, most commonly KRASG12D, that result in a dominant-active form of the KRAS GTPase. However, how KRAS mutations promote pancreatic carcinogenesis is not fully understood, and whether oncogenic KRAS is required for the maintenance of pancreatic cancer has not been established. To address these questions, we generated two mouse models of pancreatic tumorigenesis: mice transgenic for inducible KrasG12D, which allows for inducible, pancreas-specific, and reversible expression of the oncogenic KrasG12D, with or without inactivation of one allele of the tumor suppressor gene p53. Here, we report that, early in tumorigenesis, induction of oncogenic KrasG12D reversibly altered normal epithelial differentiation following tissue damage, leading to precancerous lesions. Inactivation of KrasG12D in established precursor lesions and during progression to cancer led to regression of the lesions, indicating that KrasG12D was required for tumor cell survival. Strikingly, during all stages of carcinogenesis, KrasG12D upregulated Hedgehog signaling, inflammatory pathways, and several pathways known to mediate paracrine interactions between epithelial cells and their surrounding microenvironment, thus promoting formation and maintenance of the fibroinflammatory stroma that plays a pivotal role in pancreatic cancer. Our data establish that epithelial KrasG12D influences multiple cell types to drive pancreatic tumorigenesis and is essential for tumor maintenance. They also strongly support the notion that inhibiting KrasG12D, or its downstream effectors, could provide a new approach for the treatment of pancreatic cancer.


Figures

Figure 1
Figure 1. The iKras* mouse model of pancreatic tumorigenesis.
(A) Genetic makeup of the iKras* model: p48-Cre;R26-rtTa-IRES-EGFP;TetO-KrasG12D. (B) Experimental design. Kras* expression was induced with doxy for 72 hours before 2 consecutive days of intraperitoneal cerulein injections to induce pancreatitis and neoplasia. n = 3–5 mice per time point. (C) H&E staining of wild-type murine pancreas. Scale bar: 50: μm. (D) H&E staining of iKras* murine pancreas 3 weeks after doxy induction of Kras*. Scale bar: 50 μm. (E) H&E staining of iKras* murine pancreas 3 and 5 weeks after induction of Kras* and cerulein injections. Scale bars: 50 μm. (F) H&E staining of iKras* of iKras* murine pancreas 2 days, 1 week, 3 weeks, and 5 weeks after induction of Kras* and cerulein injections. Scale bar: 20 μm. (G) Gomori trichrome staining for interstitial collagen 2 days, 1 week, 3 weeks, and 5 weeks after induction of Kras* and cerulein injections. Scale bar: 20 μm. (H) PAS staining for mucin accumulation 2 days, 1 week, 3 weeks, and 5 weeks after induction of Kras* and cerulein injections. Scale bar: 20 μm.
Figure 2
Figure 2. Kras* inactivation in mucinous ADM/early PanINs.
(A) Experimental design. Kras* expression was kept ON for 3 weeks following acute pancreatitis; then, Kras* was turned OFF; tissues were harvested at the indicated time points (arrows). n = 3–5 mice/time point. (B) Kras* expression by qRT-PCR. Each point is an individual mouse. Data represent mean ± SEM. (C) Representative Western blot showing Ras protein activity (Ras-GTP) measured by Raf1-RBD pull-down assay; as well as blots showing levels of phospho-ERK1/2, total ERK1/2, and E-cadherin. (D) Ras protein activity normalized to total Ras. (E) Ras protein activity normalized to the epithelial marker E-cadherin. (F) Histology of the pancreas at the indicated time points. Scale bar: 50 μm. (G) Activation of the MAP/ERK kinase pathway measured by phospho-ERK1/2 immunohistochemistry. Scale bar: 20 μm. (H) Quantification of the change in pancreas size. Data represent mean ± SEM. (I) Quantification of lesions at the indicated time points. Data represent mean ± SEM.
Figure 3
Figure 3. Kras* inactivation in established PanINs.
(A) Experimental design: Kras* expression was kept ON for 5 weeks following acute pancreatitis; then, Kras* was turned OFF; tissues were harvested at the indicated time points (arrows). n = 3–5 mice/time point. (B) Representative Western blot showing Ras protein activity (Ras-GTP) measured by Raf1-RBD pull-down assay. (C) Histology of the pancreas at the indicated time points. Scale bar: 50 μm. (D) MAP/ERK pathway activation shown by phospho-ERK1/2 immunohistochemistry. Scale bar: 20 μm. (E) Quantification of the change in pancreas size. Data represent mean ± SEM. (F) Quantification of pancreatic lesions. Data represent mean ± SEM. (G) Immunohistochemistry for the PanIN marker claudin-18. Scale bar: 20 μm.
Figure 4
Figure 4. Mechanism of tissue recovery from early PanINs.
Kras* expression was maintained ON for 3 weeks following pancreatitis, then turned OFF for 2 days, 3 days, and 2 weeks. n = 3–5 mice/time point. (A) Apoptosis as indicated by cleaved caspase-3 immunohistochemistry. Scale bar: 20 μm. (B) Co-immunofluorescence of PanIN lesions and tissue proliferation during tissue repair: Ki67 (green), CK19 (red), and DAPI (blue). Scale bar: 20 μm. (CF) CK19 (green), amylase (red), and DAPI (blue) co-immunofluorescence analysis of PanIN transdifferentiation in iKras* pancreas after (C) Kras* ON 3 weeks and (D) Kras* OFF 2 days, (E) 3 days, and (F) 2 weeks. Scale bar: 20 μm (G) Quantification of CK19- and amylase-positive cells at the indicated time points. Data represent mean ± SEM.
Figure 5
Figure 5. Extensive tissue remodeling in established PanINs following Kras* inactivation.
Kras* expression was maintained ON for 5 weeks following pancreatitis, then turned OFF for 2 days, 3 days, and 2 weeks. n = 3–5 mice/time point. (A) Cell death shown by cleaved caspase-3 immuno­histo­chemistry. Scale bar: 20 μm. (B) Immuno­histochemistry for the lineage tracer EGFP. Scale bar: 20 μm. (C) CK19 (green), amylase (red), and DAPI (blue) co-immuno­fluorescence. Scale bar: 20 μm. (D) Tissue proliferation shown by Ki67 immunohistochemistry. Scale bar: 20 μm. (E) Quantification of cellular proliferation (Ki67) in each tissue compartment for the indicated time points. Data represent mean ± SEM.
Figure 6
Figure 6. Oncogenic Kras* regulates interactions between epithelial cells and their microenvironment.
Kras* expression was maintained ON for 3 weeks following pancreatitis, then turned OFF for 2 days, 3 days, and 2 weeks. (A) SMA and (B) Shh ligand immunohistochemistry. Scale bar: 20 μm. (C) qRT-PCR analysis of Hedgehog signaling components Shh, Ptch1, Gli1, and Gli2. Each point represents 1 mouse. Data represent mean ± SEM. (D) Experimental design. In iKras*;Gli1LacZ/+ experimental mice, Kras* expression was kept ON for 3 weeks following pancreatitis, then turned OFF for 3 days. n = 2 mice/time point. (E) Histology. Scale bar: 50 μm. (F) β-Galactosidase staining for Gli1/LacZ expression. Scale bar: 20 μm. (G) CK19 (purple), amylase (red), Gli1/LacZ (green), and DAPI (blue) co-immunofluorescence. Scale bar: 20 μm. (H) SMA (purple), Gli1/LacZ (green), and DAPI (blue) co-immuno­fluorescence. Scale bar: 20 μm.
Figure 7
Figure 7. iKras*-p53+/– model and the effect of Kras* inactivation.
Experimental design. Kras* expression was maintained ON for 5 weeks (A) or until the mice developed frank PDA (F) before being turned OFF for 2 weeks or 23 weeks. (B and G) Histology of the pancreata at indicated time points. Scale bar: 100 μm (top row) and 20 μm (bottom row). Inset: PAS staining. Scale bar: 20 μm. (C and H) Phospho-ERK1/2 immunohistochemistry. Scale bar: 20 μm. (D and I) Ki67 immunohistochemistry. Scale bar: 20 μm. (E and J) Analysis of genomic instability in iKras*-p53+/– mice by γ-H2AX immunohistochemistry. Scale bar: 20 μm. (K) Kaplan-Meier survival curve. Log-rank statistical analysis yielded a P value of 0.0008. (L) In vivo imaging of tumor regression in one iKras*-p53+/– animal using MRI. Total animals imaged, n = 4. T, tumor, outlined in yellow; S, stomach; Sp, spleen; K, kidney; Int, intestine.
Figure 8
Figure 8. Proposed model for the role of oncogenic Kras in the initiation and maintenance of PanINs and PDA.
Initial oncogenic Kras activation leads to pancreatic dysplasia. When Kras is inactivated at the early time points, the pancreatic tissue reverts back to its original state. However, when dysplasia is advanced, or if frank PDA is present, turning off Kras will induce apoptosis in the dysplastic epithelium, and the remodeling of the pancreatic parenchyma is incomplete even after an extended period of time.

Similar articles

Cited by

References

    1. National Cancer Institute. Surveillance, Epidemiology and End Results (SEER) Program web site. http://seer.cancer.gov . Accessed December 7, 2011.
    1. American Cancer Society. Cancer Facts and Figures website. http://www.cancer.org/Research/CancerFactsFigures . Accessed December 7, 2011.
    1. Hishinuma S, Ogata Y, Tomikawa M, Ozawa I, Hirabayashi K, Igarashi S. Patterns of recurrence after curative resection of pancreatic cancer, based on autopsy findings. J Gastrointest Surg. 2006;10(4):511–518. - PubMed
    1. Katz MH, et al. Long-term survival after multidisciplinary management of resected pancreatic adenocarcinoma. Ann Surg Oncol. 2009;16(4):836–847. doi: 10.1245/s10434-008-0295-2. - DOI - PMC - PubMed
    1. Jones S, et al. Core signaling pathways in human pancreatic cancers revealed by global genomic analyses. Science. 2008;321(5897):1801–1806. doi: 10.1126/science.1164368. - DOI - PMC - PubMed

Publication types

MeSH terms

Substances