. 2012 Jan 2:4:56.
doi: 10.3389/fnmol.2011.00056. eCollection 2012.

Domain architecture of a calcium-permeable AMPA receptor in a ligand-free conformation

Affiliations

Domain architecture of a calcium-permeable AMPA receptor in a ligand-free conformation

Charles R Midgett et al. Front Mol Neurosci. .

Abstract

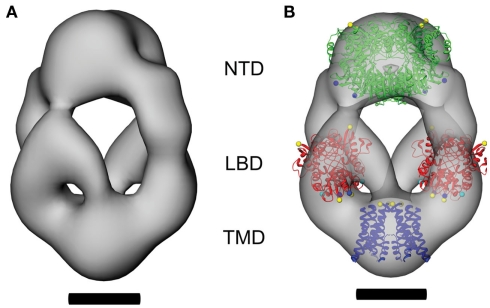
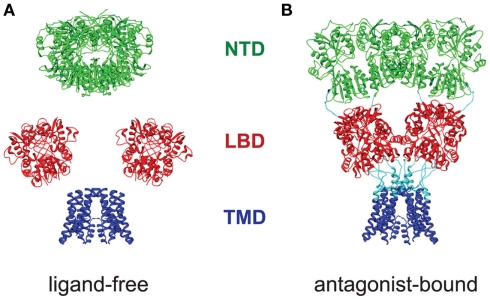
Ligand-gated ion channels couple the free energy of agonist binding to the gating of selective transmembrane ion pores, permitting cells to regulate ion flux in response to external chemical stimuli. However, the stereochemical mechanisms responsible for this coupling remain obscure. In the case of the ionotropic glutamate receptors (iGluRs), the modular nature of receptor subunits has facilitated structural analysis of the N-terminal domain (NTD), and of multiple conformations of the ligand-binding domain (LBD). Recently, the crystallographic structure of an antagonist-bound form of the receptor was determined. However, disulfide trapping of this conformation blocks channel opening, suggesting that channel activation involves additional quaternary packing arrangements. To explore the conformational space available to iGluR channels, we report here a second, clearly distinct domain architecture of homotetrameric, calcium-permeable AMPA receptors, determined by single-particle electron microscopy of untagged and fluorescently tagged constructs in a ligand-free state. It reveals a novel packing of NTD dimers, and a separation of LBD dimers across a central vestibule. In this arrangement, which reconciles diverse functional observations, agonist-induced cleft closure across LBD dimers can be converted into a twisting motion that provides a basis for receptor activation.

Keywords: electron microscopy; ionotropic glutamate receptors; ligand-gated ion channels; protein structure; receptor activation; single-particle reconstruction.


Figures

Figure 1
Figure 1
Visualization of GluA2-fusion proteins. Receptors containing GFP:GluA2 (A,B) and R2Q306c (C,D) subunits were visualized by SDS-PAGE and silver stain (A,C), showing a single band of the expected relative molar mass (Mr) for each protein. Following negative staining (B,D), both receptors were visualized as bright, stain-excluding particles (circles) with features characteristic of GluA2 channels. Mr standards are shown to the left of each gel. Scale bar = 10 nm.
Figure 2
Figure 2
GluA2-Q domain tagging. Four representative class averages are shown for GFP:GluA2 (A), R2Q306c (B), and GluA2-Q (C) receptors. Additional stain-excluding regions are visualized at the top of the projection views of both the GFP:GluA2 (A) and R2Q306c (B) receptors, adjacent to the donut-shaped feature also seen in the untagged GluA2-Q receptors (C). Scale bar = 5 nm.
Figure 3
Figure 3
The domain architecture of ligand-free GluA2-Q receptors. The CTF-corrected molecular envelope determined from class averages of untagged GluA2-Q receptors is shown (A), together with a representation in which crystal structures of two NTD dimers (green, PDB entry 3H5W; Jin et al., 2009), two LBD dimers (red, PDB entry 1FTO; Armstrong and Gouaux, 2000), and a TMD tetramer (blue, PDB entry 3KG2; Sobolevsky et al., 2009) have been fitted to determine the domain architecture of the receptor (B). Scale bars = 5 nm.
Figure 4
Figure 4
Tetrameric assembly of receptors visualized by EM. (A) Purified GluA2-Q receptors were concentrated and run on a blue-native PAGE gel with thyroglobulin, apo-ferretin, catalase, aldolase, and albumin as molecular weight standards. The relative molar masses are shown left of the gel. Native receptors were run in the first lane, and receptors treated with 1% SDS were run in the second lane. The size corresponding to GluA2-Q tetramers, dimers, and monomers are marked by a triangle, square, and circle, respectively. (B) The 3D molecular of the receptor was contoured to yield a mass equivalent to a subunit dimer, yielding a hollow, attenuated structure with dimensions similar to the molecular envelope shown in Figure 3B. Scale bar = 5 nm.
Figure 5
Figure 5
Ligand-binding domain–N-terminal domain cross-over drives ectodomain tetramerization. Representative experimental sedimentation equilibrium absorbance profiles (A280, open circles) are shown for WT (A) and L484Y (B) ectodomain constructs, together with curves predicted by a three-speed, three-channel global fit using monomer:dimer (dashed line) and monomer:dimer:tetramer [solid line (B) only] equilibrium models. The deviation between observed and calculated A280 values is shown below each profile for the monomer:dimer (open circles) and monomer:dimer:tetramer (filled squares) models. While the WT data were well fit by a monomer:dimer equilibrium (A), systematic deviations between the monomer:dimer predictions and the experimental data were observed for the L484Y mutant in the absence of a secondary dimerization reaction (B).
Figure 6
Figure 6
Movements of LBD–TMD attachment points during channel activation. (A) A view of the hybrid model from the cytoplasmic face, showing the central TMD (blue), and behind it to the left and right, the LBD dimers (red) as positioned within the arms of the molecular envelope (Figure 3B). The LBD connection points (C1–C3) that attach to the three corresponding transmembrane helices (TM1–TM3) are marked with blue, yellow, and cyan spheres, respectively. (B) The attachment points for each of the three monomers are shown schematically in the apo (white) and AMPA-bound (blue) configurations, showing the scissoring motion described in Figure A4 in Appendix. (C) Following rotations of the TMD about the channel symmetry axis to align the LBD and TMD activation trajectories, the four sets of three helices are oriented as shown schematically, as viewed from the outside of the cell. The prominent motion of the TMD helix associated with channel opening (blue) is also shown.
Figure 7
Figure 7
Magnitude of conformational changes associated with channel activation. (A) To identify conformational changes associated with channel activation or desensitization, GluA2-Q receptors were treated with 10 mM glutamate prior to EM sample preparation. Following negative staining and EM imaging, class averages were computed, which closely resemble those seen for the ligand-free receptor (Figure 2C). (B–D) To assess the ability of the ligand-free molecular envelope to accommodate the extent of LBD conformational changes associated with agonist binding, we modeled the apo (B), AMPA-bound (C), and desensitized (D) structures of the LBD dimer (PDB entries 1FTO, 1FTM, and 2I3W, respectively; Armstrong and Gouaux, ; Armstrong et al., 2006) into the molecular envelope. All three structures are accommodated. Scale bar = 5 nm.
Figure 8
Figure 8
Comparison of the domain architectures of ligand-free and antagonist-bound GluA2. The NTD (green), LBD (red), and TMD (blue) domains of ligand-free (A) and antagonist-bound (B) (PDB entry 3KG2; Sobolevsky et al., 2009) GluA2 receptors are viewed parallel to the plane of a hypothetical cell membrane. Although the horizontal dimer–dimer packing of the NTD and LBD differs noticeably, the overall vertical dimensions and domain layering of two models is conserved.
Figure A1
Figure A1
Western blots confirm the identity of GFP:GluA2, R2Q306c, and GluA2-Q receptors. To ensure that the GFP and CFP tags were incorporated purified receptors, GluA2-Q, GFP:GluR, and R2Q306c, were run on gel and blotted with either α-GluA2/3 (A) or α-GFP/CFP (B) antibodies. All receptor constructs interacted with the α-GluA2/3 antibody. Only the tagged receptors reacted with the anti-GFP/CFP antibody, as well as having the expected molecular weight shift demonstrating incorporation of the tags.
Figure A2
Figure A2
Mapping the CFP domain in the R2Q306c receptor. The site of the insertion of the CFP into the R2Q306c receptor was mapped using the GluA2 NTD structure (PDB entry 3H5W; Jin et al., 2009). The location of the N-terminus of the structure is shown in yellow and the residues surrounding the CFP insertion site are in red, top. Below the NTD structure is the primary sequence of the R2Q306c receptor (bottom) aligned with the GluA2 NTD primary sequence (top). The GluA2 NTD residues flanking the insertion site are shown in red.
Figure A3
Figure A3
Alternative orientations of the NTD dimers within the steric constraints of the ligand-free GluA2-Q molecular envelope. The crystal structure of the GluA2 NTD dimer (PDB entry 3H5W; Jin et al., 2009) is shown in two orientations. The “cooperative” orientation is shown in (A), in which an NTD dimer is oriented parallel to one of the LBD dimers. The “complementary” orientation is shown in (B), in which an NTD dimer connects to both LBD dimers by spanning the central vestibule. Scale bar = 5 nm.
Figure A4
Figure A4
Ligand-binding domain movements between the apo and AMPA-bound structures. The membrane-proximal face of the two LBD dimers is shown as viewed from the cytoplasm following superposition of the apo [(A), red] and AMPA-bound [(B), purple] states, modeled using PDB entries 1FTO and 1FTM, respectively (Armstrong and Gouaux, 2000). The residues on the LBD that connect to the TMD are colored according to the TM helix (TM1–TM3) to which they connect: C1 = Lys 506, blue; C2 = Pro 632, yellow; and C3 = Cys 773, cyan. The connecting residues are twofold symmetrical across the dimer interface and are linearly arranged. The intermonomer distances as measured from the Cα positions of the connecting residues are shown as black lines within each dimer. The C3 intermonomer distance similar in the apo and AMPA-bound structures. (C) To highlight the scissoring motion within each monomer, Lobe I of the apo (red) and AMPA-bound (purple) domains was superimposed, and the displacement of the three attachment points (connected by blue lines in each structure) are highlighted by arrows. The displacement is greatest at C2, intermediate at C1, and minimal at C3, which is closest to the hinge axis.

Similar articles

Cited by

References

    1. Abele R., Keinänen K., Madden D. R. (2000). Agonist-induced isomerization in a glutamate receptor ligand-binding domain: a kinetic and mutagenetic analysis. J. Biol. Chem. 275, 21355–2136310.1074/jbc.M909883199 - DOI - PubMed
    1. Alam A., Jiang Y. (2009). High-resolution structure of the open NaK channel. Nat. Struct. Mol. Biol. 16, 30–3410.1038/nsmb.1531 - DOI - PMC - PubMed
    1. Armstrong N., Jasti J., Beich-Frandsen M., Gouaux E. (2006). Measurement of conformational changes accompanying desensitization in an ionotropic glutamate receptor. Cell 127, 85–9710.1016/j.cell.2006.08.037 - DOI - PubMed
    1. Armstrong N. A., Gouaux E. (2000). Mechanisms for activation and antagonism of an AMPA-sensitive glutamate receptor: crystal structures of the GluR2 ligand binding core. Neuron 28, 165–18110.1016/S0896-6273(00)00094-5 - DOI - PubMed
    1. Ayalon G., Stern-Bach Y. (2001). Functional assembly of AMPA and kainate receptors is mediated by several discrete protein-protein interactions. Neuron 13, 103–11310.1016/S0896-6273(01)00333-6 - DOI - PubMed

LinkOut - more resources