. 2011 Dec 30:5:34.
doi: 10.3389/fninf.2011.00034. eCollection 2011.

High-resolution fiber tract reconstruction in the human brain by means of three-dimensional polarized light imaging

Affiliations

High-resolution fiber tract reconstruction in the human brain by means of three-dimensional polarized light imaging

Markus Axer et al. Front Neuroinform. .

Abstract

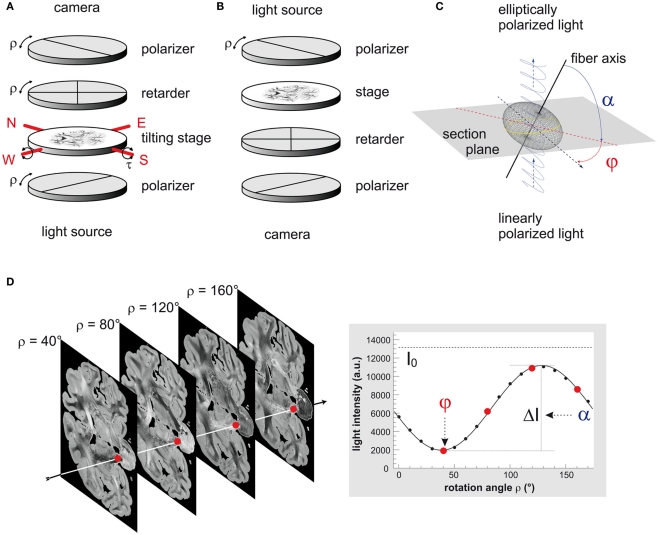
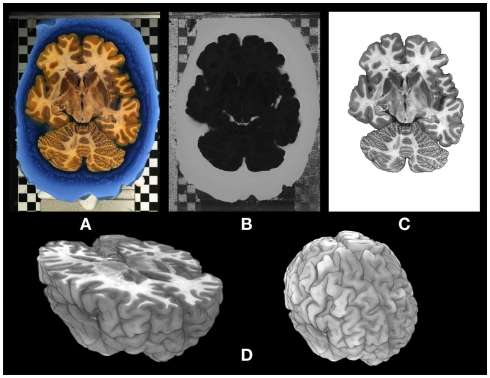
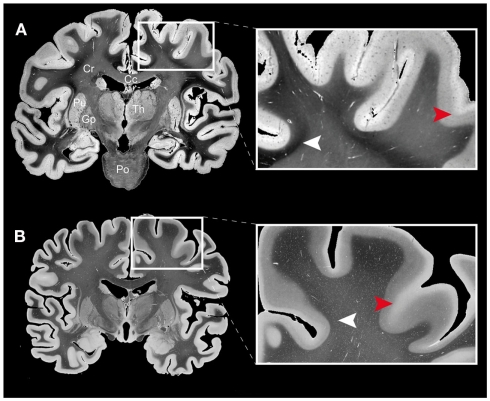
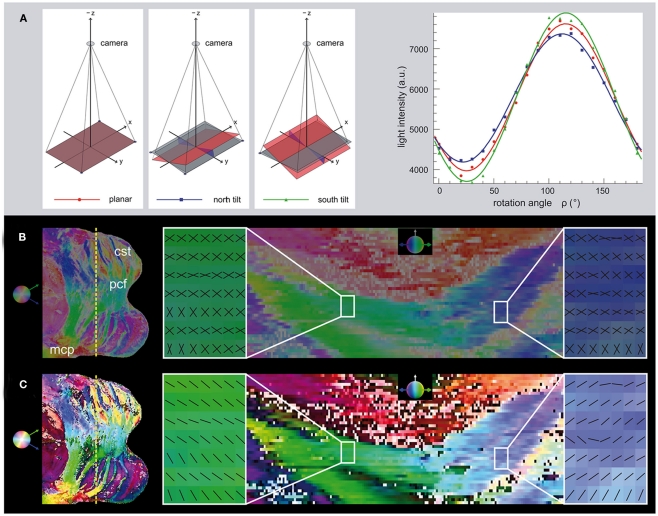
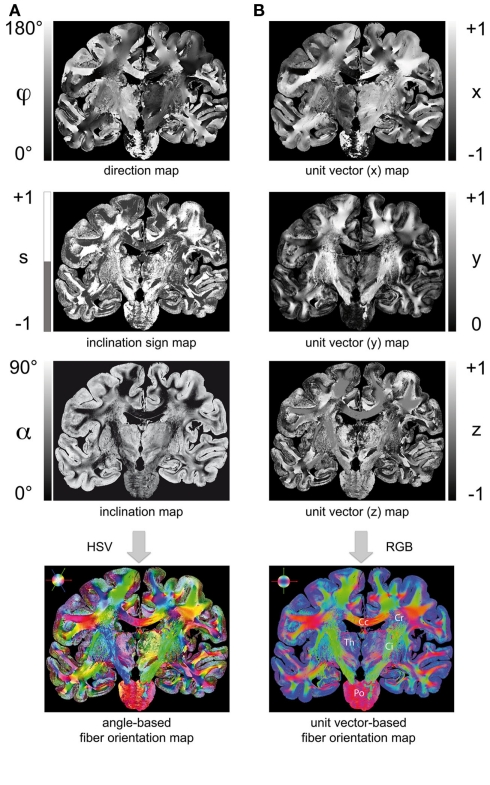
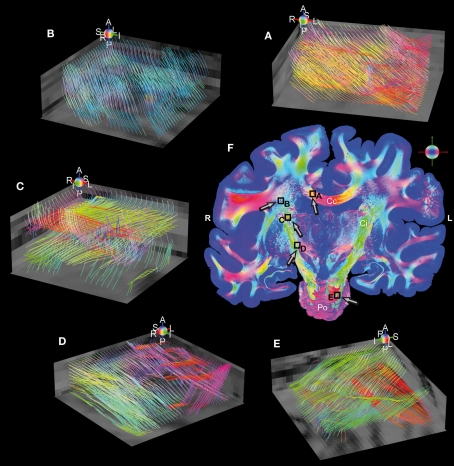
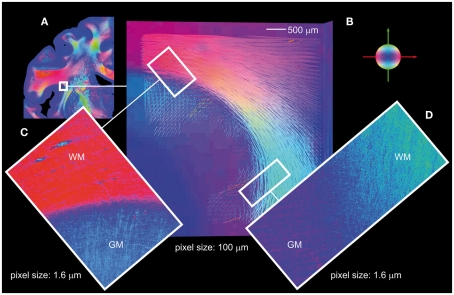
Functional interactions between different brain regions require connecting fiber tracts, the structural basis of the human connectome. To assemble a comprehensive structural understanding of neural network elements from the microscopic to the macroscopic dimensions, a multimodal and multiscale approach has to be envisaged. However, the integration of results from complementary neuroimaging techniques poses a particular challenge. In this paper, we describe a steadily evolving neuroimaging technique referred to as three-dimensional polarized light imaging (3D-PLI). It is based on the birefringence of the myelin sheaths surrounding axons, and enables the high-resolution analysis of myelinated axons constituting the fiber tracts. 3D-PLI provides the mapping of spatial fiber architecture in the postmortem human brain at a sub-millimeter resolution, i.e., at the mesoscale. The fundamental data structure gained by 3D-PLI is a comprehensive 3D vector field description of fibers and fiber tract orientations - the basis for subsequent tractography. To demonstrate how 3D-PLI can contribute to unravel and assemble the human connectome, a multiscale approach with the same technology was pursued. Two complementary state-of-the-art polarimeters providing different sampling grids (pixel sizes of 100 and 1.6 μm) were used. To exemplarily highlight the potential of this approach, fiber orientation maps and 3D fiber models were reconstructed in selected regions of the brain (e.g., Corpus callosum, Internal capsule, Pons). The results demonstrate that 3D-PLI is an ideal tool to serve as an interface between the microscopic and macroscopic levels of organization of the human connectome.

Keywords: PLI; U-fiber; connectome; human brain; method; polarized light imaging; systems biology; white matter.


Figures

Figure 1
Figure 1
Three-dimensional-polarimetry at a glance. (A) Scheme of the large-area rotating polarimeter with tilting stage (N-North, W-West, E-East, S-South). (B) Optical scheme of the polarizing microscope LMP1-1. (C) Scheme of the optical fiber model. The refractive index of a negative uniaxially birefringent medium, such as a myelinated axon, is described by an elliptically shaped oblate surface, the refractive index ellipsoid or indicatrix (gray mesh). A beam of linearly polarized light (blue trace) interacts locally with the myelin sheath of a single axon (black line), which induces a phase shift to the light beam. The light becomes elliptically polarized and serves as a direct measure of the orientation of the indicatrix or the prevailing local fiber orientation, respectively. In the frame coordinate system this orientation is determined by the in-plane direction angle φ and the out-of-section inclination angle α. (D) A typical PLI raw image data set consists of 18 images corresponding to equidistant rotation angles between 0° and 170°. Here, a selection of four images of a coronal section is shown, while the sketched arrow indicates one representative pixel. To obtain the fiber orientation, the measured light intensities are studied pixel-wise as a function of discrete rotation angles. The derived physical model provides a precise mathematical description of the measurement (continuous black line) and relates the sine phase to the direction angle φ and the amplitude to the inclination angle α. The highlighted data points correspond to the selected images.
Figure 2
Figure 2
Segmentation and 3D reconstruction of the blockface image data set. (A) Blockface image of a horizontally cut postmortem human brain represented in RGB (red-green-blue) color space. The brain is embedded in stained (luxol fast blue) gelatine. The checkerboard in the background was used for subsequent alignment of the blockface images obtained during sectioning. (B) Transformation of the RGB image into the HSV-color space enables an accurate segmentation of the image into tissue and background. The hue-channel of the blockface is shown here. (C) Segmented brain section. (D) 3D representations of the reconstructed blockface brain.
Figure 3
Figure 3
Comparison of (A) a transmittance map of a coronal whole human brain section (100 μm thickness, gelatine embedding) and (B) a coronal section from another human brain stained with the Heidenhain–Woelcke technique for myelin (20 μm thickness, paraffin embedding). The images were scaled to the same gray value range and show global similarities in their gray level distributions. However, the enlarged regions of interest from the frontal lobe (right images) document that the transmittance map yields more contrast across the white matter regions (e.g., in U-fiber regions as indicated by the white arrow heads) than the classical histological myelin staining. For cortical regions the measured intensity gradients are similar (cf. red arrow heads). Legend: Cc, corpus callosum; Cr, corona radiata; Th, thalamus; Pu, putamen; Gp, globus pallidus; Po, pons.
Figure 4
Figure 4
Determination of the ambiguous inclination sign by tilting. (A) In addition to images acquired in the standard planar position, further information can be derived from images that are tilted in north and south direction, for example. After optical rectification, the light intensity in a single pixel is plotted for the series of polar filter rotation angles. The north, south and planar tilting positions have different amplitudes. The change in the amplitude of the signal demonstrates the change in the absolute inclination angle as a result of tilting. In this case, the south tilt yields a larger amplitude and hence a higher absolute inclination angle than the north tilt. This indicates a negative inclination sign. (B) The overview of the transversal section through the Pons on the left shows the cutting plane (dotted yellow line) of the coronal view on the right. The HSV-color coding shows both possible inclination signs in the same color (Hue: transversal direction, Saturation: coronal inclination, Value: constantly 0.5). The magnified regions show the two possible fiber orientations mirrored to each other, if the inclination sign is still ambiguous. (C) After determination of the inclination sign, a decision is made for every pixel, which is color-coded by different brightness values (>0.5: positive sign, <0.5: negative sign). The magnified regions show the resulting fiber orientations. The inclination sign was determined as negative in the left region, while a positive inclination sign was derived in the right region. The orientations agree with the course of the pontocerebellar fiber bundles running toward each other from lateral to medial. Legend: cst, cortico-spinal tract; pcf, pontocerebellar fibers; mcp, middle cerebellar peduncle.
Figure 5
Figure 5
Two ways to render a fiber orientation map (FOM): (A) Transformation of a direction map, inclination sign map, and inclination map into a FOM using the HSV-color space (encoding: H = 2φ, S = 1 − α/90°, V = 1 for S > 0; H = 2φ, S = 1, V = 1 − α/90°) for S ≤ 0). (B) Transformation of the extracted fiber orientations into unit vectors (x = cos(sα)·cos(φ), y = cos(sα)·sin(φ), z = sin(sα)) and visualization in the RGB color space (encoding: R = | x |, G = | y |, B = | z |). Legend: Cc, corpus callosum; Cr, corona radiata; Ci, internal capsule; Th, thalamus; Po, pons.
Figure 6
Figure 6
Reconstructed fiber tract models in five regions of interest (volumes of 2 mm × 2 mm × 1 mm) sampled with an isotropic resolution of 100 μm. The individual color spheres (legend: A, anterior; P, posterior; I, inferior; S, superior; R, right; L, left) indicate the orientations of the fiber tract models. Fiber models were generated in (A) the Corpus callosum, (B) the Corona radiata, (C,D) the internal capsule (green), perforated by small fascicles (red and magenta) connecting the cerebral cortex with the Thalamus (C), Red nucleus and Substantia nigra (D), and (E) the Pons (green = cortico-spinal tract, red = transversal branches). Superimposed retardation maps (gray values) serve as anatomical references. (F) The RGB fiber orientation map is a representative of the stacked whole brain sections used for the study. The black rectangles highlight the magnified regions of interest (A–E) and the arrows indicate the individual observer’s perspective. Legend: Cc, corpus callosum; Ci, internal capsule; Po, pons; R, right; L, left.
Figure 7
Figure 7
Association fibers. (A) FOM of a coronal section with the indicated region of interest in the upper part of the circular sulcus of the insula. (B) Reconstructed U-fiber models (volume of 5 mm × 5 mm × 1 mm, pixel size of 100 μm) based on a stack of aligned FOMs obtained with the large-area polarimeter, covering the insular cortex and the underlying extreme capsule turning into the stem of the parietal operculum. Superficial layers of U-fibers turn into the insular cortex and into the cortex of the post-central gyrus. (C,D) Show the gray/white matter borders in the two regions of interest shown in (B), analyzed with the polarizing microscope. Note, the two 2D-FOMs reflect the fiber orientations in a single section from the center of the stack. White matter (WM) and gray matter (GM) regions are characterized by significantly different fiber tract densities and fiber orientations. Color code of the fiber orientations: red = transversal, green = axial, blue = sagittal.
Figure 8
Figure 8
Influence of the section thickness on the fiber inclination estimation. An optic tract was sectioned parallel to the main fiber direction with thicknesses of 20, 25, 50, 70, and 100 μm, and measured with the large-area polarimeter. (A) Histogram of the retardation map (|sinδ| > 0.55) of a 100 μm section and the resulting fit function (with fit parameter [p2] = |sinδ¯|α=0° used as a reference measure). (B) |sinδ¯|α=0°as a function of the section thickness. The error bars indicate the maximum deviation of the section thickness (±5 μm) and the maximum variance across the fitted histogram tail. (C) The relationship between the fiber inclination angle α and a measured retardation value is given by |sinδ|=|sin(arcsin(|sinδ¯|α=0)cos2α)|.(cf. Axer et al., 2011). Since |sinδ¯|α=0° depends on the section thickness, the usable dynamic range to separate different fiber inclinations decreases for decreasing thicknesses.

References

    1. Amunts K., Zilles K. (2006). “Atlases of the human brain: tools for functional neuroimaging,” in Neuroanatomical Tract Tracing 3: Molecules, Neurons, and Systems, eds Zaborsky L., Wouterlood F. G., Lanciego J. L. (New York: Springer; ), 566–603
    1. Axer H., Axer M., Krings T., Keyserlingk D. G. V. (2001). Quantitative estimation of 3-D fiber course in gross histological sections of the human brain using polarized light. J. Neurosci. Methods 105, 121–13110.1016/S0165-0270(00)00349-6 - DOI - PubMed
    1. Axer H., Berks G., Keyserlingk D. G. V. (2000). Visualization of nerve fiber orientation in gross-histological sections of the human brain. Microsc. Res. Tech. 51, 481–19210.1002/1097-0029(20001201)51:5<481::AID-JEMT11>3.0.CO;2-N - DOI - PubMed
    1. Axer M., Amunts K., Gräß el D., Palm C., Dammers J., Axer H., Pietrzyk U., Zilles K. (2011). A novelapproach to the humanconnectome: ultra-high resolutionmapping of fiber tracts in the brain. Neuroimage 54, 1091–110110.1016/j.neuroimage.2010.08.075 - DOI - PubMed
    1. Basser P. J., Mattiello J., Le Bihan D. (1994). Estimation of the effective self-diffusion tensor from the NMR spin-echo. J. Magn. Reson. B 103, 247–25410.1006/jmrb.1994.1037 - DOI - PubMed