. 2012 Apr 3;109(14):E851-9.
doi: 10.1073/pnas.1105543109. Epub 2012 Jan 9.

Brain structure in healthy adults is related to serum transferrin and the H63D polymorphism in the HFE gene

Affiliations

Brain structure in healthy adults is related to serum transferrin and the H63D polymorphism in the HFE gene

Neda Jahanshad et al. Proc Natl Acad Sci U S A. .

Abstract

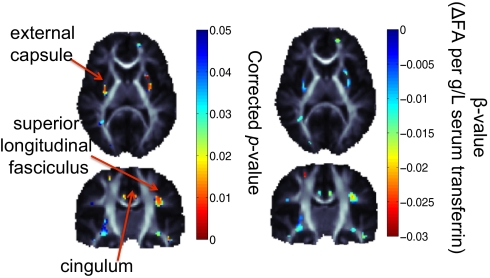
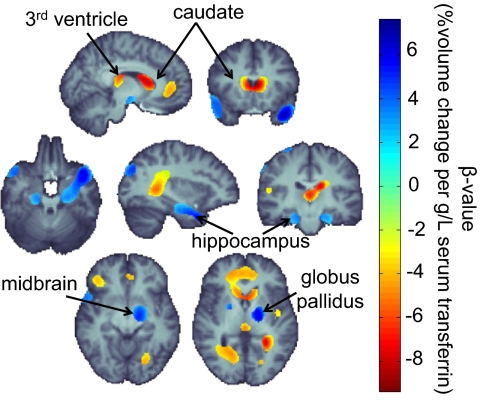
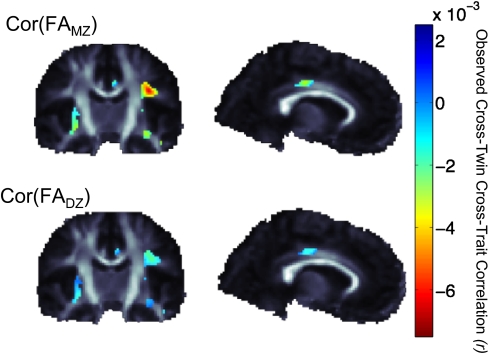
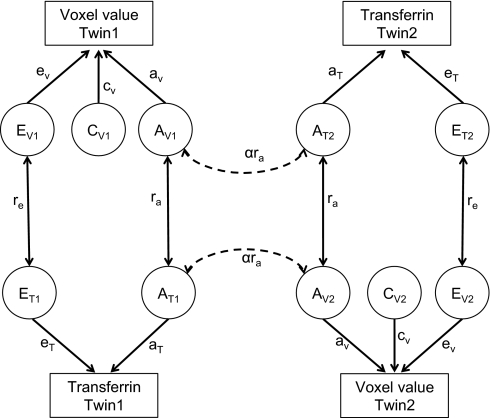
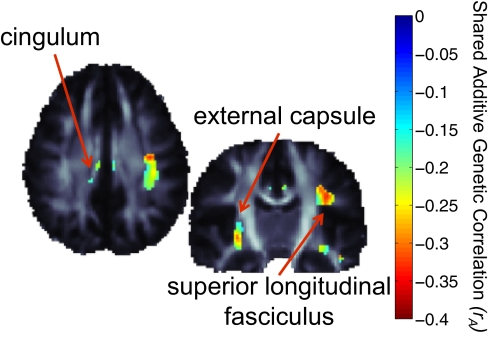
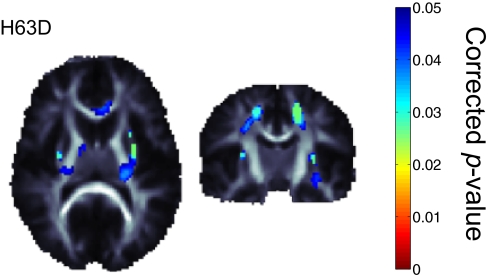
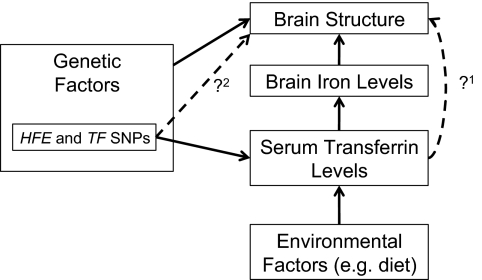
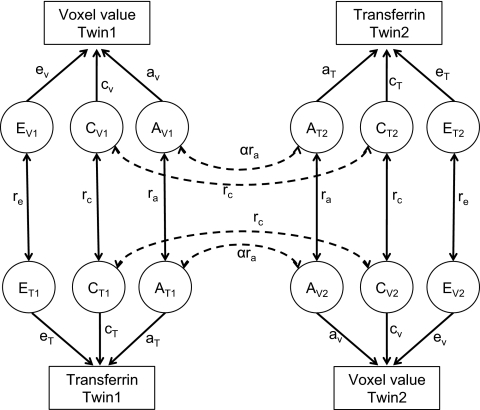
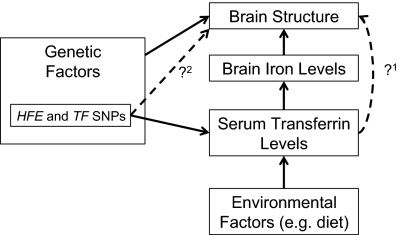
Control of iron homeostasis is essential for healthy central nervous system function: iron deficiency is associated with cognitive impairment, yet iron overload is thought to promote neurodegenerative diseases. Specific genetic markers have been previously identified that influence levels of transferrin, the protein that transports iron throughout the body, in the blood and brain. Here, we discovered that transferrin levels are related to detectable differences in the macro- and microstructure of the living brain. We collected brain MRI scans from 615 healthy young adult twins and siblings, of whom 574 were also scanned with diffusion tensor imaging at 4 Tesla. Fiber integrity was assessed by using the diffusion tensor imaging-based measure of fractional anisotropy. In bivariate genetic models based on monozygotic and dizygotic twins, we discovered that partially overlapping additive genetic factors influenced transferrin levels and brain microstructure. We also examined common variants in genes associated with transferrin levels, TF and HFE, and found that a commonly carried polymorphism (H63D at rs1799945) in the hemochromatotic HFE gene was associated with white matter fiber integrity. This gene has a well documented association with iron overload. Our statistical maps reveal previously unknown influences of the same gene on brain microstructure and transferrin levels. This discovery may shed light on the neural mechanisms by which iron affects cognition, neurodevelopment, and neurodegeneration.


Conflict of interest statement

The authors declare no conflict of interest.

Figures

Fig. 1.
Fig. 1.
Voxel-wise associations, between FA, a measure of white matter fiber integrity derived from the DW images, and serum transferrin levels in 574 subjects (five of whom had repeated scans). There are significant associations in the external capsule, superior longitudinal fasciculus, and the cingulum bilaterally. As transferrin levels increase, the diffusivity across the axons also tends to decrease by approximately 0.025 units for every g/L unit increase in the serum transferrin level. Significance was confirmed by enforcing a regional control over the FDR as described by Langers et al. (70) at the 5% level. Corrected P values of association are shown. Maps are adjusted for effects of age and sex; random-effects regression accounted for familial relatedness and the use of repeated scans. β-values shown represent the regression coefficient (or slope) of the transferrin level term, after accounting for covariates.
Fig. 2.
Fig. 2.
Brain regions where there are detectable associations between serum transferrin levels and patterns of brain morphometry. Higher blood transferrin levels were associated with greater regional brain volumes in the hippocampus and basal ganglia, including the globus pallidus bilaterally and midbrain regions appearing to contain the substantia nigra. Shrinkage in structure volume is seen as transferrin levels increase bilaterally in the caudates, the third ventricle, as well as temporoparietal regions of white matter. Lower regional volumes are also observed in frontal gray matter in those with higher serum transferrin levels. The greatest regional brain volume deficit, per unit difference in transferrin levels, is seen in the caudate, whereas the greatest expansion is detected in the hippocampus and basal ganglia. All highlighted regions were significant after a multiple comparisons correction that enforces a regional control over the FDR at the 5% level as described by Langers et al. (70). Maps are adjusted for effects of age and sex; random-effects regression accounted for familial relatedness and the use of repeated scans (N = 652 scans, N = 615 subjects). All images are in radiological convention: the left side shown is the right hemisphere. The β-value corresponds to the unnormalized slope of the regression. Corrected P values range from 0.001 to 0.05; uncorrected values range from 2.6 × 10⁻⁶ to 0.04 for the thresholded regions shown.
Fig. 3.
Fig. 3.
The magnitude of the observed cross-twin cross-trait (FA and transferrin) correlations are higher in identical than fraternal twin pairs, supporting our hypothesis that partially overlapping sets of genes may explain some of the shared variance in brain structure and transferrin levels. This motivates the use of bivariate ACE modeling to estimate the degree of shared genetic influence.
Fig. 4.
Fig. 4.
Path diagram for the best-fitting model of the bivariate association. The models that best fitted the data were the AE model for transferrin and ACE model for the imaging measures. The measures we examined included regional brain volumes and measures of microstructural white matter fiber integrity.
Fig. 5.
Fig. 5.
Significant cross-twin cross-trait correlations for transferrin levels and brain FA. The P value controlling the FDR at the 5% level in regions of significant FA-transferrin associations was 0.032. The significant cross-twin cross-trait correlations presented here indicate that partially overlapping sets of genes are associated with transferrin levels and brain FA values in bilateral white matter regions, including the cingulum, external capsule, and superior longitudinal fasciculus. Negative correlations indicate lower anisotropy, perhaps indicating lower levels of myelination with increases in transferrin levels. Positive correlations were not significant.
Fig. 6.
Fig. 6.
Corrected p-map shows the HFE H63D associations with FA voxel-wise throughout the white matter. When regressing on the minor allele, there is a positive association between the number of minor alleles and the FA values. Significance was confirmed by enforcing a regional control over the FDR as described by Langers et al. (70) at the 5% level. We adjusted for effects of age and sex to be consistent with the previous tests. Positive correlations were not significant.
Fig. 7.
Fig. 7.
Several known relationships motivated our study (solid black lines); dashed lines show relationships we wanted to test. Genetic and environmental factors (e.g., diet) affect iron stores in the body; the liver synthesizes more transferrin in response to low iron stores. Our first goal was to relate transferrin levels to brain structure in healthy young adults. Our twin design determined if overlapping sets of genes influence transferrin levels and brain structure, as both are highly heritable. Transferrin levels are genetically modulated mainly through two genes (HFE and TF); to relate specific variants in transferrin-related genes to brain structure, we determined the additive effect of all variants within these two genes on brain structures that had shown genetic influences in common with transferrin.
Fig. 8.
Fig. 8.
Path diagram for the full bivariate ACE model.
Fig. P1.
Fig. P1.
Iron levels in the blood and brain have many complex relationships with healthy brain development and risk for disease in old age. We also know that levels of the iron transport protein, transferrin, can determine how much iron is available to help maintain the healthy wiring of the brain. Several known relationships motivated our study (solid black lines), and dashed lines show relationships we wanted to test. Genetic and environmental factors (e.g., diet) affect iron stores in the body; the liver synthesizes more transferrin in response to low iron stores. Our first goal was to relate transferrin levels to brain structure in healthy young adults. Our twin design determined if overlapping sets of genes influence transferrin levels and brain structure, as both are highly heritable. Transferrin levels are genetically modulated mainly through two genes (HFE and TF); to relate specific variants in transferrin-related genes to brain structure, we determined the additive effect of all variants within these two genes on brain structures that had shown genetic influences in common with transferrin.

References

    1. CDC From the Centers for Disease Control and Prevention. Iron deficiency—United States, 1999-2000. JAMA. 2002;288:2114–2116. - PubMed
    1. Halterman JS, Kaczorowski JM, Aligne CA, Auinger P, Szilagyi PG. Iron deficiency and cognitive achievement among school-aged children and adolescents in the United States. Pediatrics. 2001;107:1381–1386. - PubMed
    1. Stoltzfus RJ, et al. Effects of iron supplementation and anthelmintic treatment on motor and language development of preschool children in Zanzibar: Double blind, placebo controlled study. BMJ. 2001;323:1389–1393. - PMC - PubMed
    1. Nelson C, Erikson K, Piñero DJ, Beard JL. In vivo dopamine metabolism is altered in iron-deficient anemic rats. J Nutr. 1997;127:2282–2288. - PubMed
    1. Bartzokis G, et al. In vivo evaluation of brain iron in Alzheimer's disease and normal subjects using MRI. Biol Psychiatry. 1994;35:480–487. - PubMed

Publication types

LinkOut - more resources