. 2012 Jan 24;109(4):1062-7.
doi: 10.1073/pnas.1109034109. Epub 2012 Jan 9.

Structuring economic incentives to reduce emissions from deforestation within Indonesia

Affiliations

Structuring economic incentives to reduce emissions from deforestation within Indonesia

Jonah Busch et al. Proc Natl Acad Sci U S A. .

Abstract

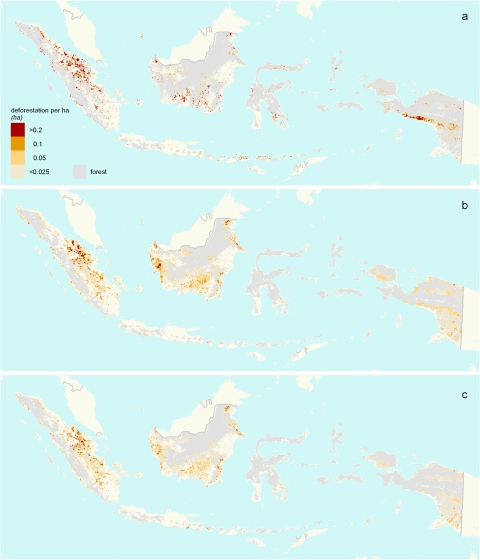
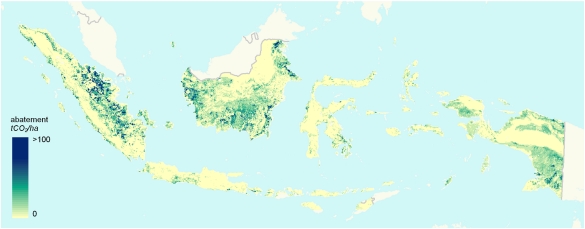
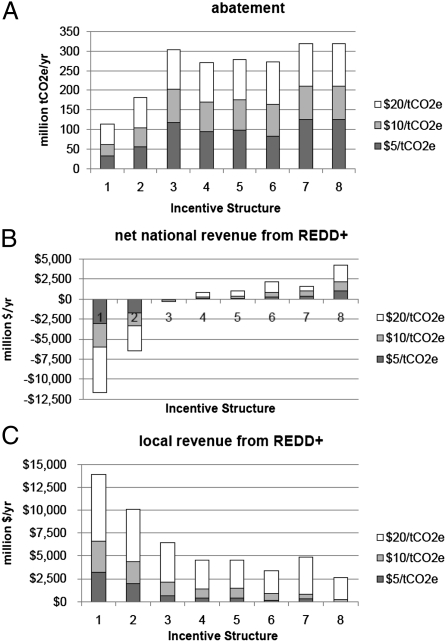
We estimate and map the impacts that alternative national and subnational economic incentive structures for reducing emissions from deforestation (REDD+) in Indonesia would have had on greenhouse gas emissions and national and local revenue if they had been in place from 2000 to 2005. The impact of carbon payments on deforestation is calibrated econometrically from the pattern of observed deforestation and spatial variation in the benefits and costs of converting land to agriculture over that time period. We estimate that at an international carbon price of $10/tCO(2)e, a "mandatory incentive structure," such as a cap-and-trade or symmetric tax-and-subsidy program, would have reduced emissions by 163-247 MtCO(2)e/y (20-31% below the without-REDD+ reference scenario), while generating a programmatic budget surplus. In contrast, a "basic voluntary incentive structure" modeled after a standard payment-for-environmental-services program would have reduced emissions nationally by only 45-76 MtCO(2)e/y (6-9%), while generating a programmatic budget shortfall. By making four policy improvements--paying for net emission reductions at the scale of an entire district rather than site-by-site; paying for reductions relative to reference levels that match business-as-usual levels; sharing a portion of district-level revenues with the national government; and sharing a portion of the national government's responsibility for costs with districts--an "improved voluntary incentive structure" would have been nearly as effective as a mandatory incentive structure, reducing emissions by 136-207 MtCO(2)e/y (17-26%) and generating a programmatic budget surplus.


Conflict of interest statement

The authors declare no conflict of interest.

Figures

Fig. 1.
Fig. 1.
Deforestation in Indonesia, 2000–2005. (A) observed deforestation (687 kha/y; 860 mtCO2e/y); (B) modeled expected deforestation without REDD+ (691 kha/y; 809 mtCO2e/y); (C) expected deforestation with “improved voluntary incentive structure” for REDD+ (597 kha/y; 633 mtCO2e/y). Results are outputs of OSIRIS-Indonesia v1.5 assuming the following parameters: carbon price = $10/tCO2e; “effective” price elasticity = 3.8; exogenous agricultural price increase = 0%; peat emission factor = 1,474 tCO2e/ha; social preference for agricultural revenue relative to carbon revenue = 1.0; start-up and transaction costs = $0.
Fig. 2.
Fig. 2.
Expected spatial distribution of abatement under REDD+, Indonesia 2000–2005. Expected abatement provided in response to a price of $10 tCO2e paid for voluntary site-level emission reductions below business-as-usual levels. Darker blue represents greater voluntary abatement of emissions from deforestation in response to incentive payments. Expected abatement is greatest where deforestation emissions would be high in the absence of REDD+ but low in the presence of REDD+. Results are outputs of OSIRIS-Indonesia v1.5 assuming the following parameters: carbon price = $10/tCO2e; “effective” price elasticity = 0.0 (no leakage); exogenous agricultural price increase = 0%; peat emission factor = 1,474 tCO2e/ha; social preference for agricultural revenue relative to carbon revenue = 1.0; start-up and transaction costs = $0; site-level accounting; national government share of revenue = 0%; national government share of responsibility for costs = 100%.
Fig. 3.
Fig. 3.
Abatement (A), national revenue (B), and local revenue (C) under alternative national economic incentive structures for REDD+. (A–C) Incentive structures: Column 1: site-scale accounting; historical reference levels; no benefit sharing; no responsibility sharing (“basic voluntary incentive structure” or VIS). Column 2: Basic VIS + district-scale accounting. Column 3: Basic VIS + district-scale accounting + business-as-usual reference levels. Column 4: Basic VIS + district-scale accounting + business-as-usual reference levels + 20% revenue sharing. Column 5: district-scale accounting + business-as-usual reference levels + 20% revenue sharing + 20% responsibility sharing (“improved voluntary incentive structure”). Column 6: Improved VIS + 10% reduction to district reference levels; Column 7: District-scale accounting + business-as-usual reference levels + 0% revenue sharing + 100% responsibility sharing + 10% reduction to district reference levels (“mandatory incentive structure”). Column 8: Mandatory incentive structure + 26% reduction to district reference levels. For parameter assumptions, see the legend to Fig. 1.

References

    1. UNFCCC Decision 1/CP.16 (UNFCCC, Bonn, Germany) 2010
    1. Cattaneo A, et al. On international equity in reducing emissions from deforestation. Environ Sci Policy. 2010;13:742–753.
    1. Cattaneo A. Robust design of multiscale programs to reduce deforestation. Environ Dev Econ. 2011;16:455–478.
    1. Montero JP. Optimal design of a phase-in emissions trading program. J Public Econ. 2000;75:273–291.
    1. Grieg-Gran M. The Cost of Avoiding Deforestation. London, UK: IIED; 2006.

Publication types