

Microbial diversity determines the invasion of soil by a bacterial pathogen
- PMID: 22232669
- PMCID: PMC3268289
- DOI: 10.1073/pnas.1109326109
Microbial diversity determines the invasion of soil by a bacterial pathogen
Abstract
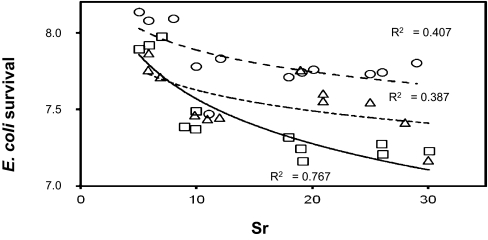
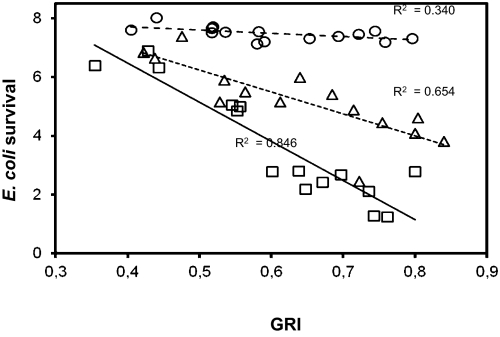
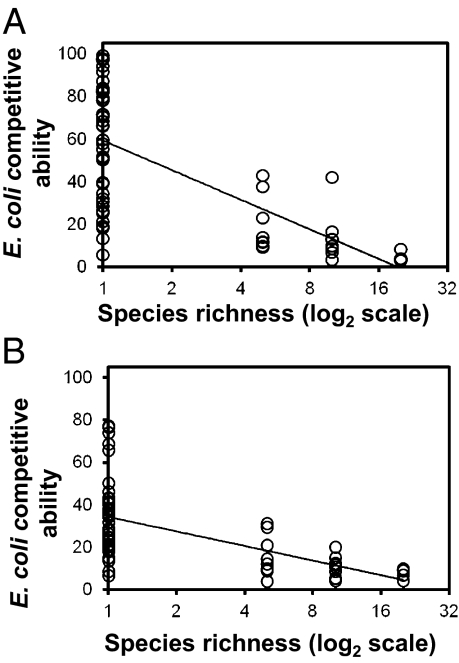
Natural ecosystems show variable resistance to invasion by alien species, and this resistance can relate to the species diversity in the system. In soil, microorganisms are key components that determine life support functions, but the functional redundancy in the microbiota of most soils has long been thought to overwhelm microbial diversity-function relationships. We here show an inverse relationship between soil microbial diversity and survival of the invading species Escherichia coli O157:H7, assessed by using the marked derivative strain T. The invader's fate in soil was determined in the presence of (i) differentially constructed culturable bacterial communities, and (ii) microbial communities established using a dilution-to-extinction approach. Both approaches revealed a negative correlation between the diversity of the soil microbiota and survival of the invader. The relationship could be explained by a decrease in the competitive ability of the invader in species-rich vs. species-poor bacterial communities, reflected in the amount of resources used and the rate of their consumption. Soil microbial diversity is a key factor that controls the extent to which bacterial invaders can establish.
Conflict of interest statement
The authors declare no conflict of interest.
Figures


Similar articles
-
The legacy of bacterial invasions on soil native communities.Environ Microbiol. 2021 Feb;23(2):669-681. doi: 10.1111/1462-2920.15086. Epub 2020 Jun 10. Environ Microbiol. 2021. PMID: 32419297
-
Survival of genetically marked Escherichia coli O157:H7 in soil as affected by soil microbial community shifts.ISME J. 2007 Jul;1(3):204-14. doi: 10.1038/ismej.2007.21. Epub 2007 May 31. ISME J. 2007. PMID: 18043631
-
Influence of fumigants on soil microbial diversity and survival of E. coli O157:H7.J Environ Sci Health B. 2010 Jul;45(5):416-26. doi: 10.1080/03601231003800073. J Environ Sci Health B. 2010. PMID: 20512732
-
The impact of failure: unsuccessful bacterial invasions steer the soil microbial community away from the invader's niche.ISME J. 2018 Mar;12(3):728-741. doi: 10.1038/s41396-017-0003-y. Epub 2018 Jan 26. ISME J. 2018. PMID: 29374268 Free PMC article.
-
Modeling the fate of Escherichia coli O157:H7 and Salmonella enterica in the agricultural environment: current perspective.J Food Sci. 2014 Apr;79(4):R421-7. doi: 10.1111/1750-3841.12392. Epub 2014 Mar 25. J Food Sci. 2014. PMID: 24665963 Review.
Cited by
-
Manure-Based Amendments Influence Surface-Associated Bacteria and Markers of Antibiotic Resistance on Radishes Grown in Soils with Different Textures.Appl Environ Microbiol. 2021 Apr 27;87(10):e02753-20. doi: 10.1128/AEM.02753-20. Print 2021 Apr 27. Appl Environ Microbiol. 2021. PMID: 33712421 Free PMC article.
-
Survival of Listeria monocytogenes in Soil Requires AgrA-Mediated Regulation.Appl Environ Microbiol. 2015 Aug;81(15):5073-84. doi: 10.1128/AEM.04134-14. Epub 2015 May 22. Appl Environ Microbiol. 2015. PMID: 26002901 Free PMC article.
-
Nutrient levels and trade-offs control diversity in a serial dilution ecosystem.Elife. 2020 Sep 11;9:e57790. doi: 10.7554/eLife.57790. Elife. 2020. PMID: 32915132 Free PMC article.
-
Parasite diversity and coinfection determine pathogen infection success and host fitness.Proc Natl Acad Sci U S A. 2012 Jun 5;109(23):9006-11. doi: 10.1073/pnas.1201790109. Epub 2012 May 21. Proc Natl Acad Sci U S A. 2012. PMID: 22615371 Free PMC article.
-
Impact of bacterial and fungal inoculants on the resident rhizosphere microbiome and the volatilome of tomato plants under leaf herbivory stress.FEMS Microbiol Ecol. 2024 Jan 24;100(2):fiad160. doi: 10.1093/femsec/fiad160. FEMS Microbiol Ecol. 2024. PMID: 38331428 Free PMC article.
References
-
- Vitousek PM, Dantonio CM, Loope LL, Westbrooks R. Biological invasions as global environmental change. Am Sci. 1996;84:468–478.
-
- Levine JM, D'Antonio CM. Elton revisited: A review of evidence linking diversity and invasibility. Oikos. 1999;87:15–26.
-
- Tilman D. The ecological consequences of changes in biodiversity: A search for general principles. Ecology. 1999;80:1455–1474.
-
- Fargione JE, Tilman D. Diversity decreases invasion via both sampling and complementarity effects. Ecol Lett. 2005;8:604–611.
Publication types
MeSH terms
LinkOut - more resources
Full Text Sources
Other Literature Sources
