. 2012 Jan 24;109(4):1347-52.
doi: 10.1073/pnas.1118018109. Epub 2012 Jan 9.

Digital RNA sequencing minimizes sequence-dependent bias and amplification noise with optimized single-molecule barcodes

Affiliations

Digital RNA sequencing minimizes sequence-dependent bias and amplification noise with optimized single-molecule barcodes

Katsuyuki Shiroguchi et al. Proc Natl Acad Sci U S A. .

Abstract

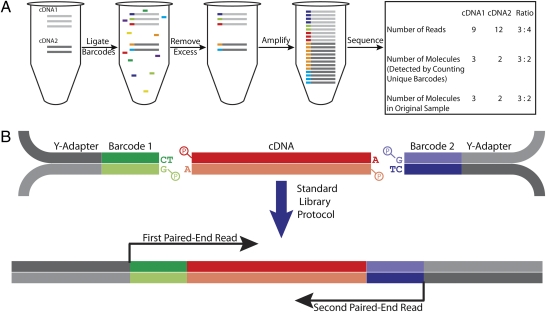
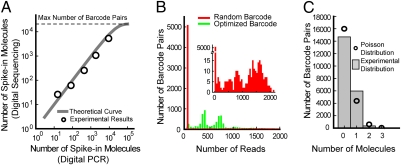
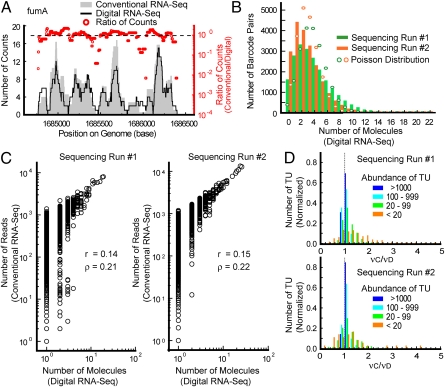
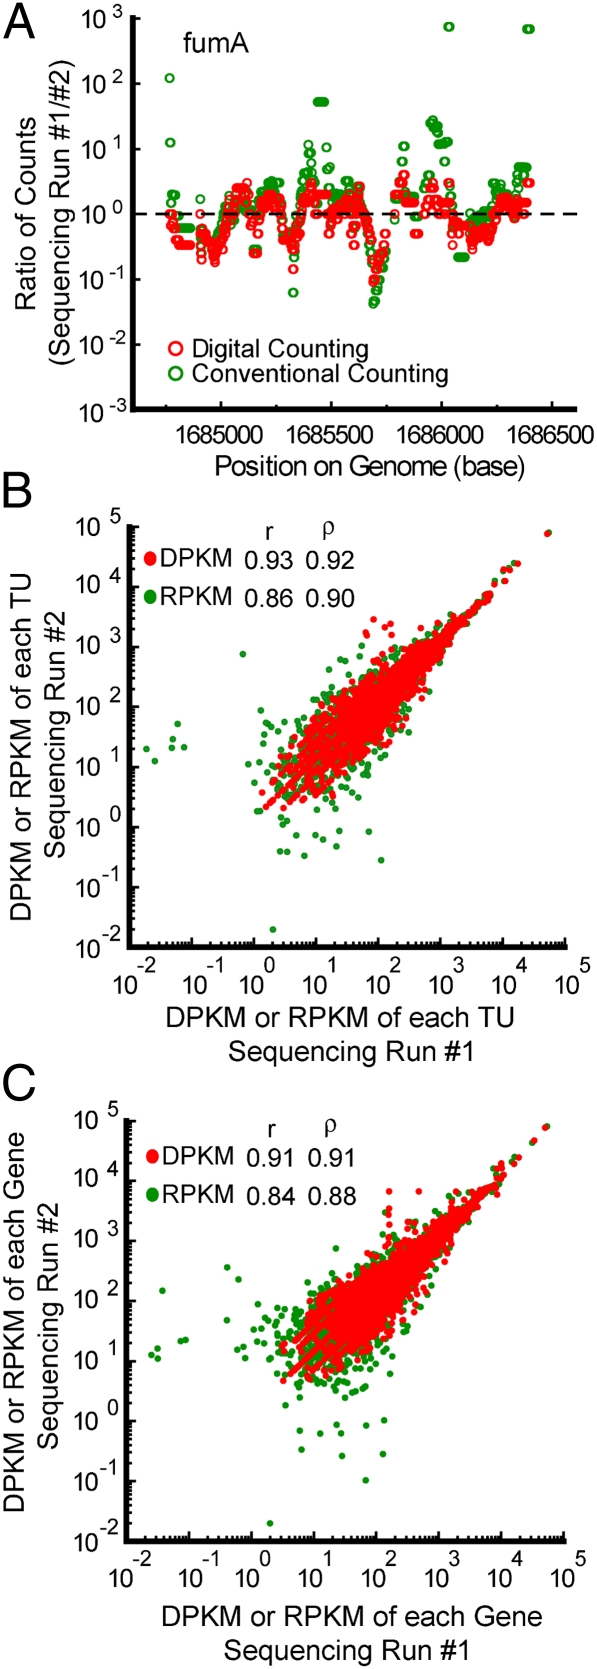
RNA sequencing (RNA-Seq) is a powerful tool for transcriptome profiling, but is hampered by sequence-dependent bias and inaccuracy at low copy numbers intrinsic to exponential PCR amplification. We developed a simple strategy for mitigating these complications, allowing truly digital RNA-Seq. Following reverse transcription, a large set of barcode sequences is added in excess, and nearly every cDNA molecule is uniquely labeled by random attachment of barcode sequences to both ends. After PCR, we applied paired-end deep sequencing to read the two barcodes and cDNA sequences. Rather than counting the number of reads, RNA abundance is measured based on the number of unique barcode sequences observed for a given cDNA sequence. We optimized the barcodes to be unambiguously identifiable, even in the presence of multiple sequencing errors. This method allows counting with single-copy resolution despite sequence-dependent bias and PCR-amplification noise, and is analogous to digital PCR but amendable to quantifying a whole transcriptome. We demonstrated transcriptome profiling of Escherichia coli with more accurate and reproducible quantification than conventional RNA-Seq.


Conflict of interest statement

Conflict of interest statement: Harvard University has filed a provisional patent application based on this work.

Figures

Fig. 1.
Fig. 1.
Our scheme of digital RNA-Seq. (A) General principle of digital RNA-Seq. Assume the original sample contains two cDNA sequences, one with three copies and another with two copies. An overwhelming number of unique barcode sequences are added to the sample in excess, and five are randomly ligated to the cDNA molecules. Ideally, each cDNA molecule in the sample receives a unique barcode sequence. After removing the excess barcodes, the barcoded cDNA molecules are amplified by PCR. Because of intrinsic noise and sequence-dependent bias, the barcoded cDNA molecules are amplified unevenly. Consequently, after the amplicons are sequenced, it appears that there are three copies of cDNA1 for every four copies of cDNA2 based on the relative number of reads for each sequence. However, the ratio in the original sample was 3:2, which is accurately reflected in the relative number of unique barcodes associated with each cDNA sequence. (B) In our implementation of A, we found it advantageous to randomly ligate both ends of each phosphorylated cDNA fragment to a barcoded phosphorylated Illumina Y-shaped adapter. Note that the single T and A overhangs present on the barcodes and cDNA, respectively, are to enhance ligation efficiency. After this step, the sample is amplified by PCR and prepared for sequencing using the standard Illumina library protocol. For each amplicon, both barcode sequences and both strands of the cDNA sequence are read using paired-end deep sequencing.
Fig. 2.
Fig. 2.
Spike-in sequence quantification. (A) Correlation between the number of spike-in molecules for five different spike-in sequences as measured by digital PCR and digital counting of unique barcodes. The theoretical curve, which saturates because of the finite number of barcode pairs (21,025), is calculated based on the Poisson distribution (18). (B) Histograms of the number of reads corresponding to each observed barcode attached to the most abundant spike-in sequence for two experiments. The red histogram corresponds to a spike-in sequence labeled with random barcode sequences, and the green histogram corresponds to a spike-in sequence labeled with our optimized barcodes. Note the left-most bin in the red histogram is >10-times larger than that of the green histogram and contains a large number of unique barcodes with a low number of reads. This discrepancy is caused by various sequencing and PCR amplification errors, which generate new artifactual unique barcodes not present in the original sample and result in a large number of falsely identified unique barcodes (SI Materials and Methods). (Inset) The red histogram in greater detail. (C) Histogram of the number of times a barcode pair was observed with all five spike-in sequences (i.e., the number of spike-in molecules attached to a given barcode pair). Because the spike-in sequences sample the barcode pairs randomly with very little bias, the histogram follows a Poisson distribution.
Fig. 3.
Fig. 3.
Digital quantification of the E. coli transcriptome. (A) Conventional and digital counting results for the fumA transcription unit (TU) as a function of genome position. The conventional counts were calculated by using a conventional calibration curve that allows regression of the number of reads against the number of input molecules for all spike-in molecules (Fig. 2A). The digital counts were obtained by counting the number of unique barcodes associated with each fragment. The red dots are the ratios of these two numbers for each base. (B) Histograms of the number of times a barcode pair was observed with the E. coli cDNA sequences (i.e., the number of cDNA molecules attached to a given barcode pair) in the two replicates. Barcode sampling is more biased on average for E. coli cDNA fragments, but is still in reasonably good agreement with Poisson statistics. (C) Correlation between the number of reads (conventional counting) and the number of molecules obtained from digital counting of unique barcodes for every mapped fragment in the two replicates. For low copy molecules, the conventional counts are distributed over three orders-of-magnitude; this is because the conventional method counts amplicons, which are subject to intrinsic noise (11), rather than directly counting molecules in the original samples like the digital counting method. We note that higher copy fragments are less affected by intrinsic noise (11), as the number of molecules sequenced is greater; this effectively allows averaging over the read counts of many molecules in conventional RNA-Seq, decreasing the variance of counting in the process. (D) Uniformity of conventional vs. digital counting along the length of each transcription unit as a function of transcription unit abundance across the whole E. coli transcriptome for both replicates. We calculated the variation νD = sDD (where μD and sD are the mean and sample SD of the digital counts among 99-base bins in a transcription unit, respectively) associated with digital counting and the variation νC = sCC associated with conventional counting within each transcription unit for which at least three bins contained on average at least one read. We then created the histogram of the ratio between conventional and digital counting variation (νCD) for transcription units in different abundance ranges for each replicate. Transcription unit abundance is the sum of all digital counts for each fragment in the transcription unit.
Fig. 4.
Fig. 4.
Reproducibility of digital and conventional quantification of the E. coli transcriptome. (A) Ratio of counts between two replicate sequencing runs normalized by total uniquely mapped reads for digital counting plotted along with the ratio of counts between the two replicates for conventional counting of the fumA transcription unit. As expected, the ratio fluctuates over a broader range for conventional counting than digital counting along the length of the transcription unit. (B) Correlation between replicate sequencing runs for digital and conventional counting of transcription units. DPKM represents the uniquely mapped digital counts per kilobase per million total uniquely mapped molecules. RPKM represents the uniquely mapped reads per kilobase per million total uniquely mapped reads. (C) Correlation between replicate sequencing runs for digital and conventional counting of genes. Taken together, B and C demonstrate that digital counting is globally more reproducible than conventional counting.

Similar articles

Cited by

References

    1. Mortazavi A, Williams BA, McCue K, Schaeffer L, Wold B. Mapping and quantifying mammalian transcriptomes by RNA-Seq. Nat Methods. 2008;5:621–628. - PubMed
    1. Nagalakshmi U, et al. The transcriptional landscape of the yeast genome defined by RNA sequencing. Science. 2008;320:1344–1349. - PMC - PubMed
    1. Dohm JC, Lottaz C, Borodina T, Himmelbauer H. Substantial biases in ultra-short read data sets from high-throughput DNA sequencing. Nucleic Acids Res. 2008;36:e105. - PMC - PubMed
    1. Aird D, et al. Analyzing and minimizing PCR amplification bias in Illumina sequencing libraries. Genome Biol. 2011;12:R18. - PMC - PubMed
    1. Zheng W, Chung LM, Zhao H. Bias detection and correction in RNA-Sequencing data. BMC Bioinformatics. 2011;12:290. - PMC - PubMed

Publication types

MeSH terms

Substances

Associated data