Comparative Study
. 2012 Jan 24;109(4):1239-44.
doi: 10.1073/pnas.1120385109. Epub 2012 Jan 9.

Digoxin inhibits development of hypoxic pulmonary hypertension in mice

Affiliations
Comparative Study

Digoxin inhibits development of hypoxic pulmonary hypertension in mice

Edsel M Abud et al. Proc Natl Acad Sci U S A. .

Abstract

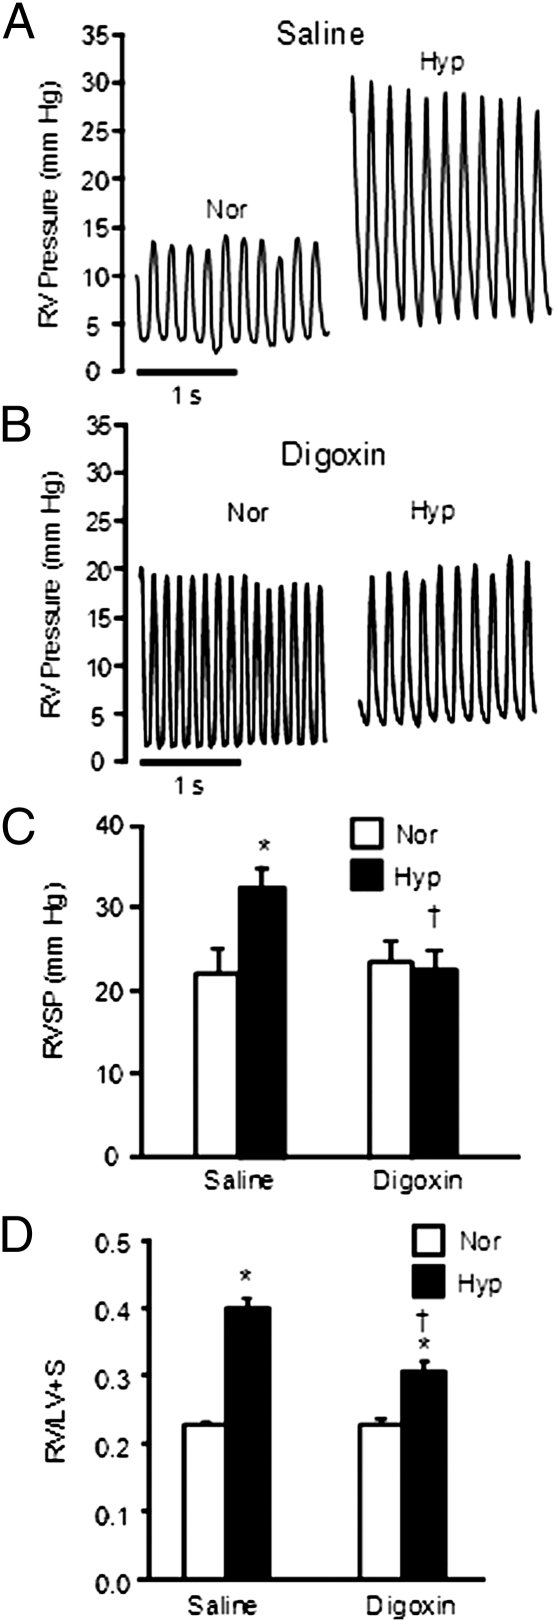
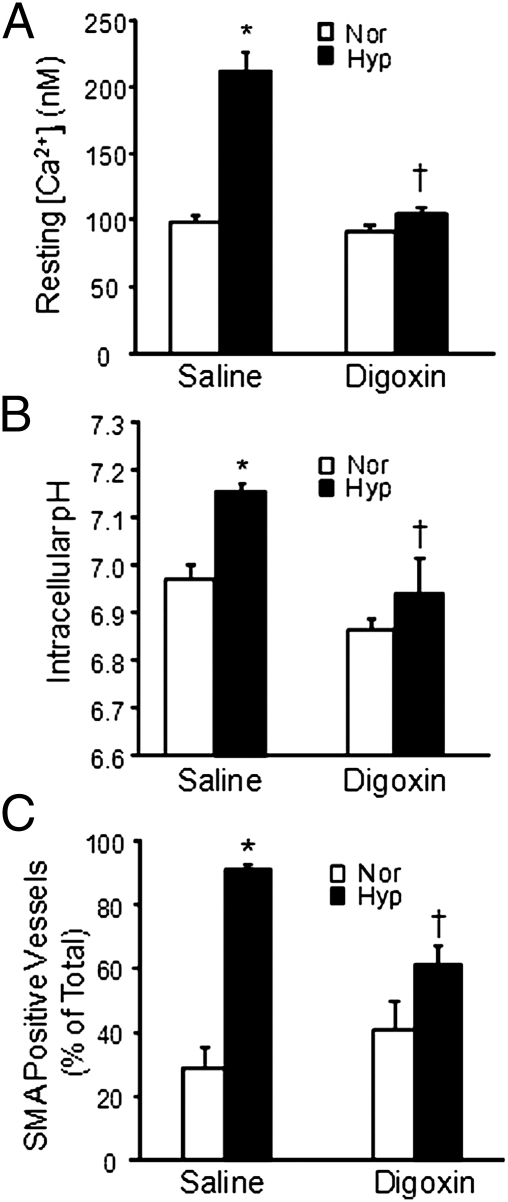
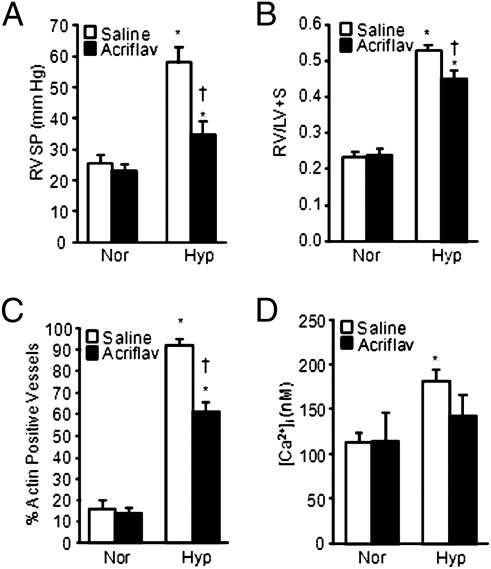
Chronic hypoxia is an inciting factor for the development of pulmonary arterial hypertension. The mechanisms involved in the development of hypoxic pulmonary hypertension (HPH) include hypoxia-inducible factor 1 (HIF-1)-dependent transactivation of genes controlling pulmonary arterial smooth muscle cell (PASMC) intracellular calcium concentration ([Ca(2+)](i)) and pH. Recently, digoxin was shown to inhibit HIF-1 transcriptional activity. In this study, we tested the hypothesis that digoxin could prevent and reverse the development of HPH. Mice were injected daily with saline or digoxin and exposed to room air or ambient hypoxia for 3 wk. Treatment with digoxin attenuated the development of right ventricle (RV) hypertrophy and prevented the pulmonary vascular remodeling and increases in PASMC [Ca(2+)](i), pH, and RV pressure that occur in mice exposed to chronic hypoxia. When started after pulmonary hypertension was established, digoxin attenuated the hypoxia-induced increases in RV pressure and PASMC pH and [Ca(2+)](i). These preclinical data support a role for HIF-1 inhibitors in the treatment of HPH.


Conflict of interest statement

The authors declare no conflict of interest.

Figures

Fig. 1.
Fig. 1.
Effect of digoxin treatment on RV parameters. (A and B) Representative tracings of RV pressures in normoxic (Nor) and chronically hypoxic (Hyp) mice treated with saline (A) or 1 mg/kg digoxin (B). (C) Bar graph (mean ± SEM) shows effect of digoxin on RVSP. Mice were injected with saline or 1 mg/kg digoxin per day (n = 6 for Nor-saline, n = 7 for Hyp-saline, n = 8 for Nor-digoxin, and n = 7 for Hyp-digoxin). (D) Effect of digoxin treatment on RVH. Bar graphs (mean ± SEM) show RV/LV+S weight ratio in mice exposed to normoxia or hypoxia in the absence or presence of digoxin (n = 8 for Nor-saline and Hyp-saline; n = 9 for Nor-digoxin and Hyp-digoxin). *Significant difference compared to normoxia value of the same treatment; significant difference compared to Hyp-saline.
Fig. 2.
Fig. 2.
Effect of digoxin on resting [Ca2+]i and pHi in PASMCs and on pulmonary vascular remodeling. (A) Basal [Ca2+]i and (B) basal pHi in PASMCs from normoxic (Nor) and chronically hypoxic (Hyp) mice treated with saline or 1 mg/kg per day digoxin (mean ± SEM). For [Ca2+]i, n = 67 cells from four mice for Nor-saline, n = 94 cells from five mice for Hyp-saline, n = 63 cells from four mice for Nor-digoxin, and n = 112 cells from seven mice for Hyp-digoxin. For pHi, n = 88 cells from four mice for Nor-saline, n = 110 cells from five mice for Hyp-saline, n = 54 cells from three mice for Nor-digoxin, and n = 104 cells from five mice for Hyp-digoxin. (C) Bar graph shows mean ± SEM data for the percentage of vessels identified as SMA positive in lung sections from normoxic and hypoxic mice treated with saline or digoxin. For each group, n = 5 mice. *Significant difference compared to normoxia value within treatment; significant difference compared to Hyp-saline.
Fig. 3.
Fig. 3.
Effect of digoxin on the expression of genes regulated by HIF-1. (A) Quantitative real-time RT-PCR analysis of GLUT1, TRPC1, and NHE1 mRNA levels in lung tissue from chronically hypoxic mice treated with saline or digoxin (1 mg/kg per day). (B) Analysis of GLUT1, TRPC1, and NHE1 mRNA levels in PASMCs exposed to hypoxia ex vivo (4% O2; 60 h). Levels of target gene mRNAs were normalized to cyclophilin mRNA levels within samples, and data are expressed as fold change relative to levels measured in normoxia under the same treatment conditions (n = 3–4 per group). *Significant difference compared to saline (in panel A) or vehicle (in panel B).
Fig. 4.
Fig. 4.
Effect of digoxin treatment on established HPH. Mice were injected with 0 (saline), 0.2 mg/kg, or 1.0 mg/kg digoxin per day for the final 2 wk of a 5-wk hypoxic exposure. (A) Effect of digoxin on RVSP (mean ± SEM; n = 5 for saline treated and n = 7 for 0.2-digoxin and 1.0-digoxin). (B and C) Mean basal [Ca2+]i and pHi in PASMCs isolated from chronically hypoxic mice. For [Ca2+]i, n = 49 cells from four mice for saline, n = 34 cells from three mice for 0.2-digoxin, and n = 32 cells from three mice for 1.0-digoxin. For pHi, n = 42 cells from three mice for saline, n = 38 cells from three mice for 0.2-digoxin, and n = 47 cells from three mice for 1.0-digoxin. Significant difference compared to saline.
Fig. 5.
Fig. 5.
Effect of acriflavine treatment on HPH in rats. (A) Effect of acriflavine (acriflav) on RVSP (mean ± SEM) in normoxic (Nor) and chronically hypoxic (Hyp) rats. Rats were injected with saline or 2.0 mg/kg acriflavine per day. (B) RV/LV+S ratio (mean ± SEM) in rats exposed to normoxia or hypoxia in the absence or presence of acriflavine. (C) Percentage of total vessels (mean ± SEM) that were identified as SMA positive in lung sections from normoxic and hypoxic rats treated with saline or acriflavine. In all experiments, n = 5 rats per group. *Significant difference compared to normoxia value within treatment; significant difference compared to Hyp-saline. (D) Basal [Ca2+]i (mean ± SEM) in PASMCs from normoxic and hypoxic rats treated with saline (n = 94 cells from five rats for normoxia and 92 cells from five rats for hypoxia) or acriflavine (n = 100 cells from five rats for normoxia and 110 cells from five rats for hypoxia).

References

    1. Tuder RM, Yun JH, Bhunia A, Fijalkowska I. Hypoxia and chronic lung disease. J Mol Med (Berl) 2007;85:1317–1324. - PubMed
    1. Morrell NW, et al. Cellular and molecular basis of pulmonary arterial hypertension. J Am Coll Cardiol. 2009;54(1, Suppl):S20–S31. - PMC - PubMed
    1. Humbert M, et al. Cellular and molecular pathobiology of pulmonary arterial hypertension. J Am Coll Cardiol. 2004;43(12, Suppl S):13S–24S. - PubMed
    1. Rios EJ, Fallon M, Wang J, Shimoda LA. Chronic hypoxia elevates intracellular pH and activates Na+/H+ exchange in pulmonary arterial smooth muscle cells. Am J Physiol Lung Cell Mol Physiol. 2005;289:L867–L874. - PubMed
    1. Shimoda LA, Fallon M, Pisarcik S, Wang J, Semenza GL. HIF-1 regulates hypoxic induction of NHE1 expression and alkalinization of intracellular pH in pulmonary arterial myocytes. Am J Physiol Lung Cell Mol Physiol. 2006;291:L941–L949. - PubMed

Publication types

MeSH terms